

At a glance
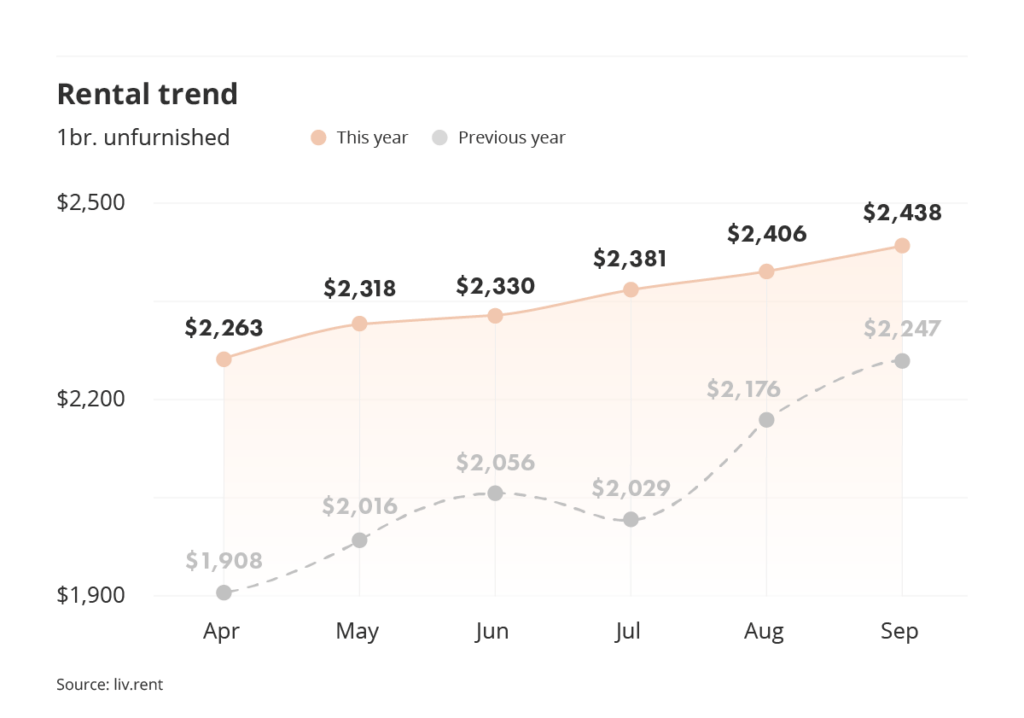
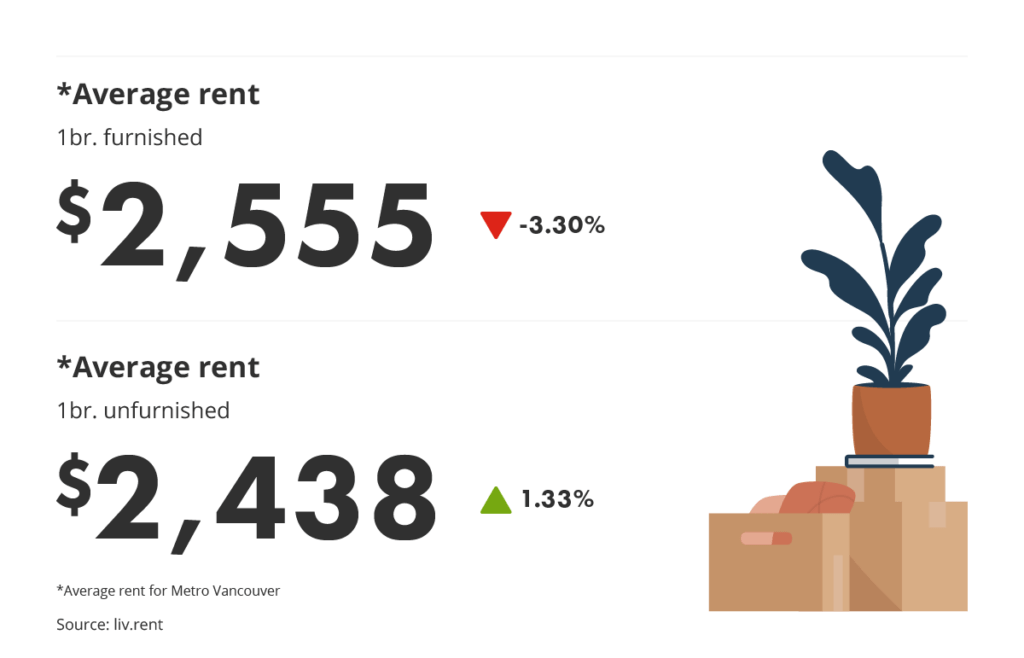
- This September marks the sixth consecutive month-to-month increase for Metro Vancouver’s average rent prices. This month, the average monthly rent price for a one-bedroom, unfurnished unit in Metro Vancouver has risen by $32 to a new average of $2,438.
- Average monthly rent prices for both furnished & unfurnished one-bedroom units in Vancouver have fallen this month.
- West Point Grey/UBC is now Vancouver’s most expensive neighbourhood to rent a one-bedroom, unfurnished unit in, while Hastings-Sunrise is the city’s least expensive neighbourhood.
Looking for our full September 2023 Metro Vancouver Rent Report? Download your copy here to get all the latest insights, including a detailed breakdown by neighbourhood.
Coinciding with the busy back-to-school season and continued high demand for rental housing throughout B.C.’s Lower Mainland region, Metro Vancouver’s rent prices have seen another average increase this month. The Bank of Canada also announced on September 6th that it would maintain the target overnight rate, noting that there are promising signs that excess demand is gradually falling as inflation begins to stabilize. While this hasn’t yet had a noticeable impact on the country’s rent prices, it’s possible that the fall and winter see lower rates as demand lessens.
We’ve published our 2022 Canada-wide Annual Rent Report with even more rental data and statistics, including overarching trends and predictions for the year ahead. You can download your copy here.
Let’s take a look now at the current rental costs and overarching trends in Vancouver for September 2023. Don’t forget, you can download the entire report as a PDF below.
Download The Latest Vancouver Rent Report
For the complete Vancouver rent report including new neighbourhood breakdowns, download here.
Average rent across Metro Vancouver
For September 2023, Metro Vancouver’s average rent prices have increased once again, marking six consecutive month-to-month increases beginning in the spring of this year. This month, the average monthly rent price for an unfurnished, one-bedroom unit rose by a further $32, to a new average of $2,438.The region’s average monthly rent price has now increased by $191 since this time last year.
Planning on raising rent this year? B.C.’s Annual allowable rent increase limit for 2023 is 2.0%. Find out when and how you can increase rent and ensure you’re complying with provincial guidelines by reading our updated Guide to B.C. Rent Increases.
>> Recommended Reading: [Updated for 2023] How Much Can Landlords Increase Rent in BC?
Month-to-month rent change
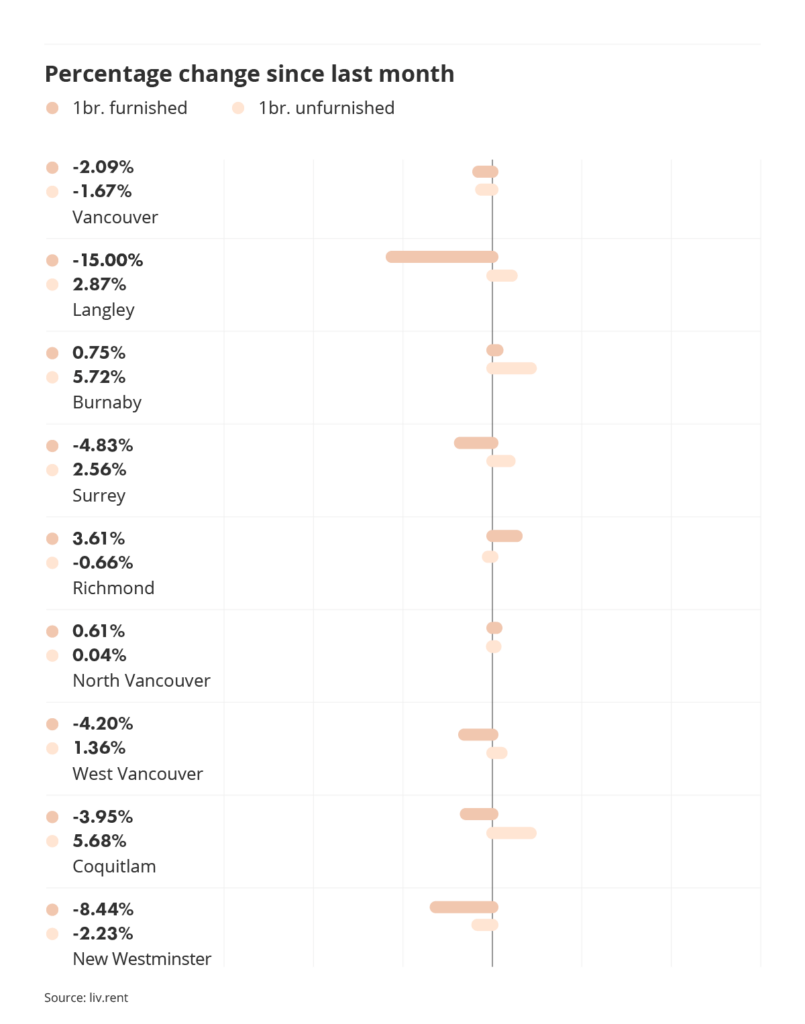
To get a better sense of how rent prices changed in Metro Vancouver’s individual cities, let’s break down the major changes for both furnished and unfurnished units this September.
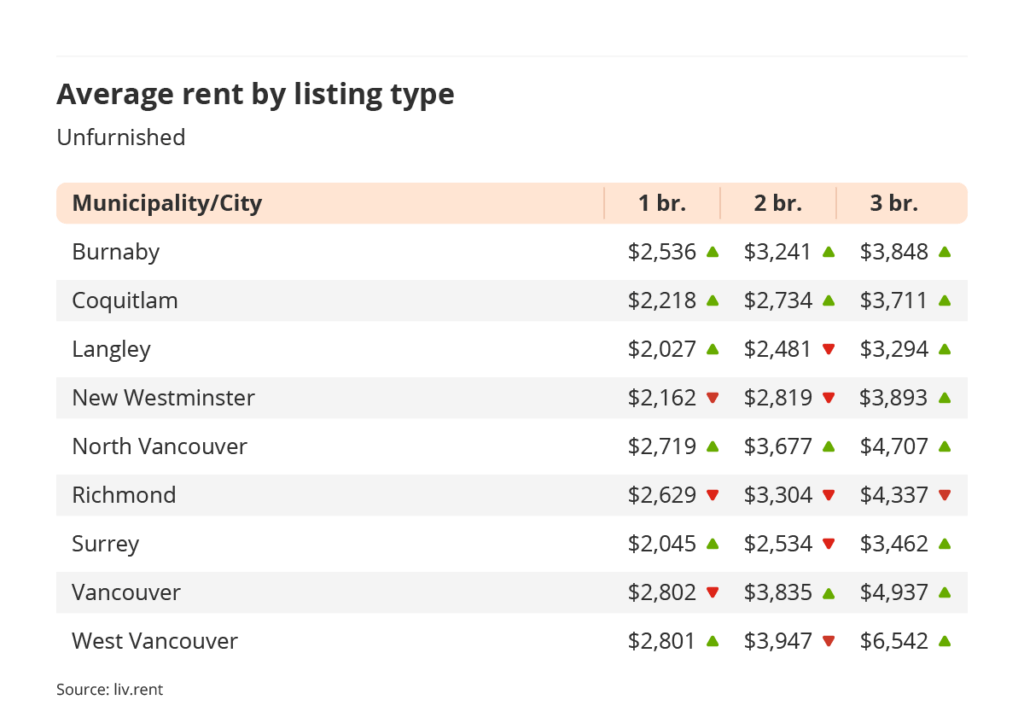
This month, prices for unfurnished, one-bedroom units in Metro Vancouver’s various municipalities were relatively stable. Burnaby (+5.72%), Coquitlam (5.68%), and Langley (+2.87%) saw the most significant increases from month to month, while the only noteworthy declines were in New Westminster (-2.23%) and Vancouver (-1.67%).
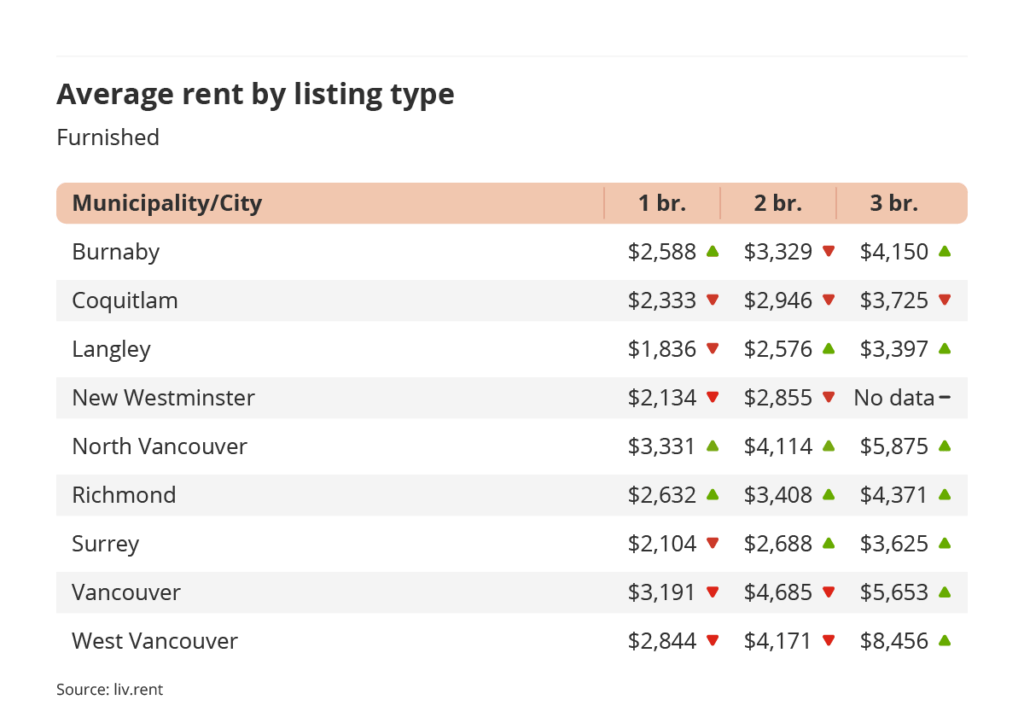
Rent prices for furnished units, on the other hand, largely saw decreases on average in Metro Vancouver’s individual communities. Langley (-15.00%) had the most significant decrease in the average rent for a furnished, one-bedroom unit, followed by New Westminster (-8.44%), Surrey (-4.83%), and West Vancouver (-4.20%).
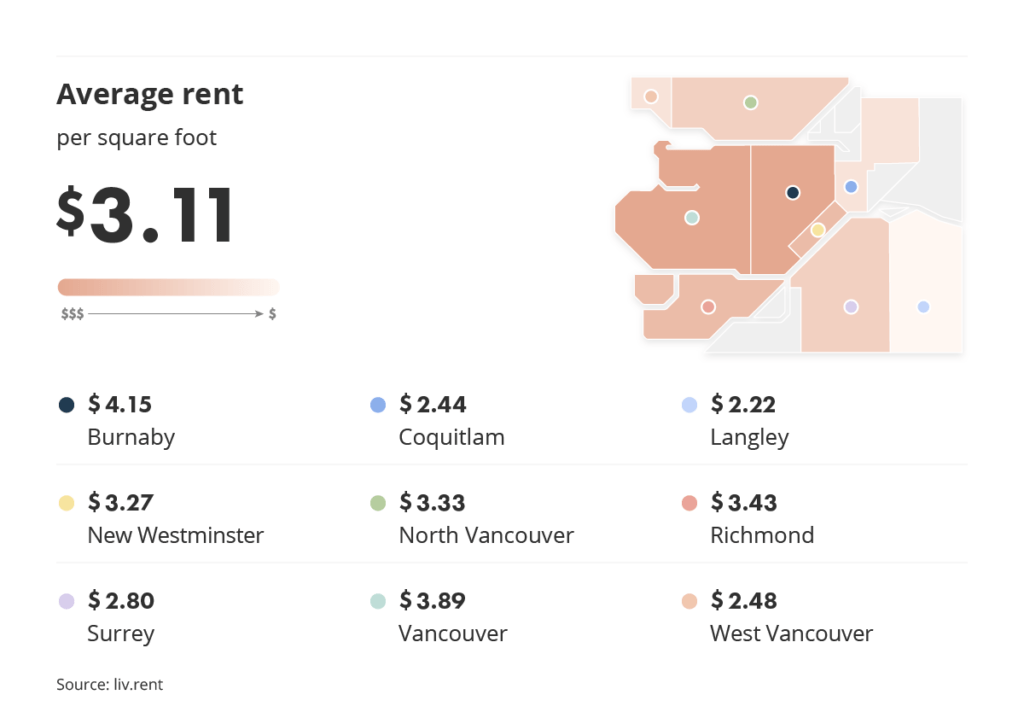
Rent per square foot
Where’s the cheapest place to rent in Metro Vancouver for how much space you get? As of September 2023, the least expensive cities for square footage are Langley, Coquitlam, and West Vancouver while the most expensive cities for square footage are Burnaby, Vancouver, and Richmond.
Is your rental priced competitively?
Find out with a free rent estimate. Our team of rental experts will calculate your unit’s true value based on your listing details & current market trends.
Active listing data
We’ll also take a look at detailed statistics for currently active listings available on the market to see which property types and number of bedrooms are the most represented. For renters, these numbers show which types of units you’re most likely to encounter in the Metro Vancouver region, while for landlords, you can assess how much competition you’ll face based on the current supply.
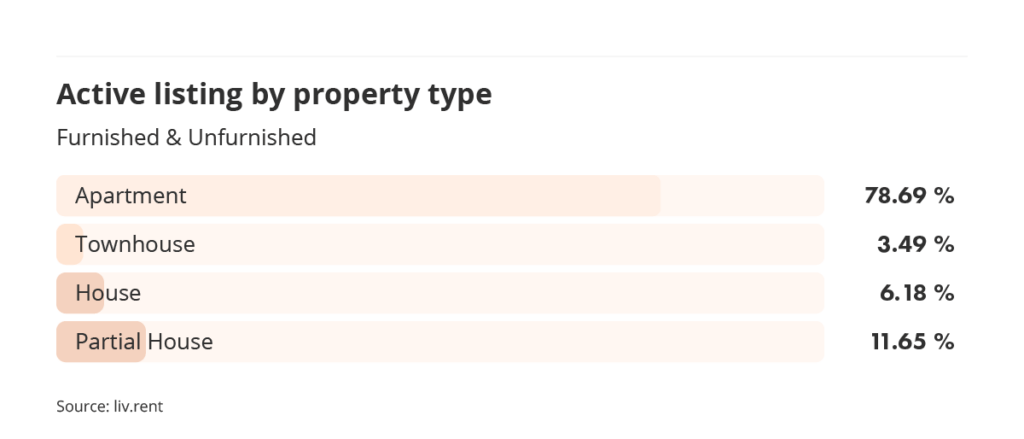
Active listings by property type
For September 2023, the most common rental property type by far was apartments, representing 78.69% of active listings on the market. Partial houses (e.g. basement suites) were the second-most rented unit type this month, at 11.65% of active listings currently available to rent.
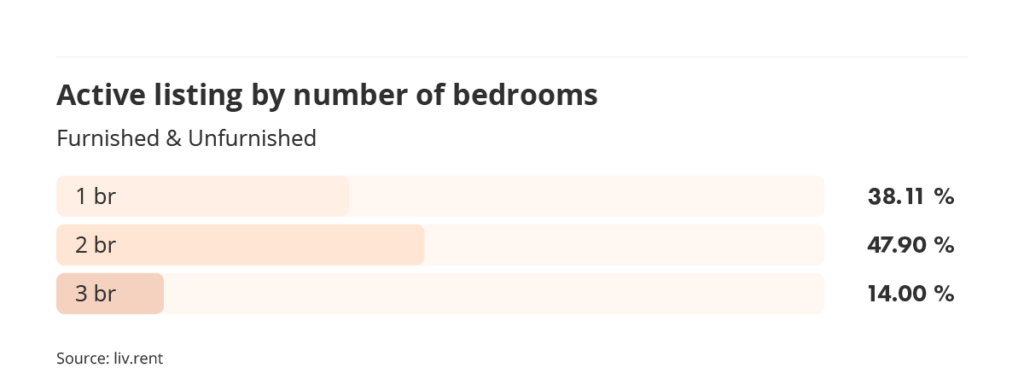
Active listings by number of bedrooms
In terms of the number of bedrooms, we saw a much more even spread across active listings on the market this September. Two-bedroom units were the most common type of listing this month at 47.90%, though one-bedroom units still represented 38.11% of all active listings on the market.
Average unfurnished vs. furnished rates
Average prices for unfurnished, one-bedroom units rose this month, while prices for furnished units fell. This September, unfurnished one-bedroom units are, on average, just $117 less expensive than furnished units. This indicates that landlords who choose to rent their units furnished will be able to charge slightly more for rent, while also capitalizing on demand for short-term rentals.
Is your rental priced competitively?
Find out with a free rent estimate. Our team of rental experts will calculate your unit’s true value based on your listing details & current market trends.
City breakdown
Metro Vancouver’s rental averages vary greatly across the region, so we’ve broken up our data by municipality/city to compare the cost of one-, two-, and three-bedroom rates for both furnished and unfurnished units in different areas.
- Unfurnished, one-bedroom units in Vancouver cost just $1 more to rent on average than in West Vancouver this September
- Langley had the least expensive average rent prices for one-bedroom, furnished & unfurnished units, for the second consecutive month.
- Average rent prices fell for both furnished & unfurnished one-bedroom units in Vancouver this September.
Gain comprehensive insights about your listings with the new liv.rent Landlord listing Dashboard. Sign in to unlock live insights – find out the average rent for a comparable property, number of views your listing received and more!
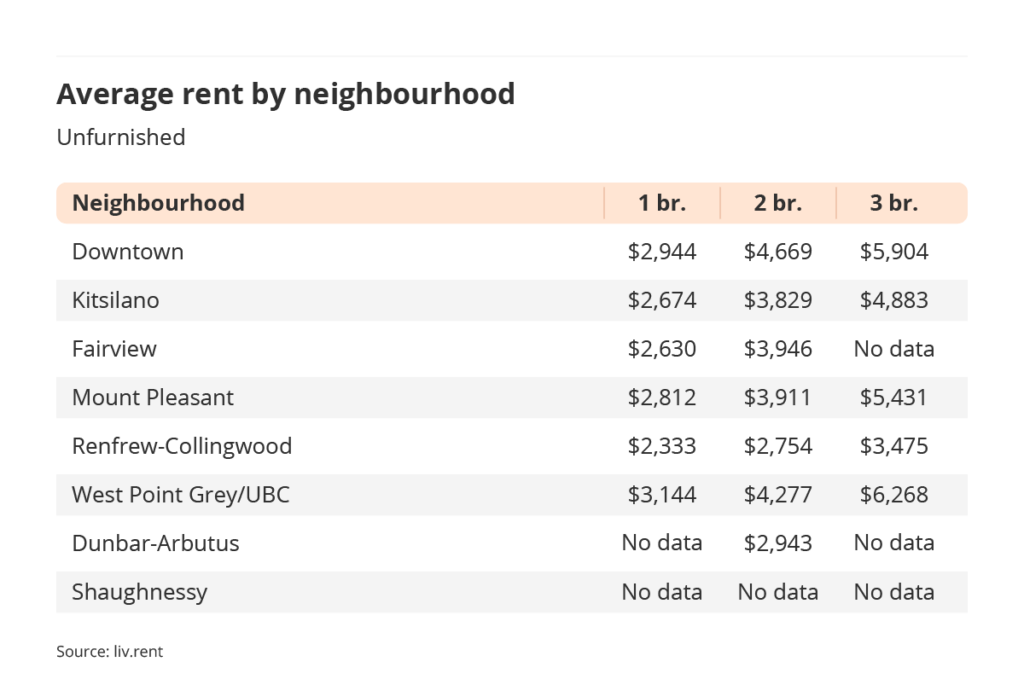
Neighbourhood breakdown
We’ve broken down Vancouver into its individual neighbourhoods for a more complete look at the city’s rental markets. For a further breakdown of neighbourhoods in municipalities and cities outside of Vancouver, be sure to download our complete Rent Report.
Let’s take a look now at some of the latest averages from Vancouver’s many unique neighbourhoods. West Point Grey/UBC is Vancouver’s most expensive neighbourhood to rent in this September at an average of $3,144 per month for an unfurnished, one-bedroom unit. The same type of unit rents for an average of $2,162 in Vancouver’s cheapest neighbourhood, Hastings-Sunrise.
We’ve recently added more new neighbourhoods to our monthly reports that aren’t shown in the data below. To see data on these additional neighbourhoods, statistics for furnished rentals, as well as full information for other cities in Metro Vancouver, be sure to download your copy of our full report here.
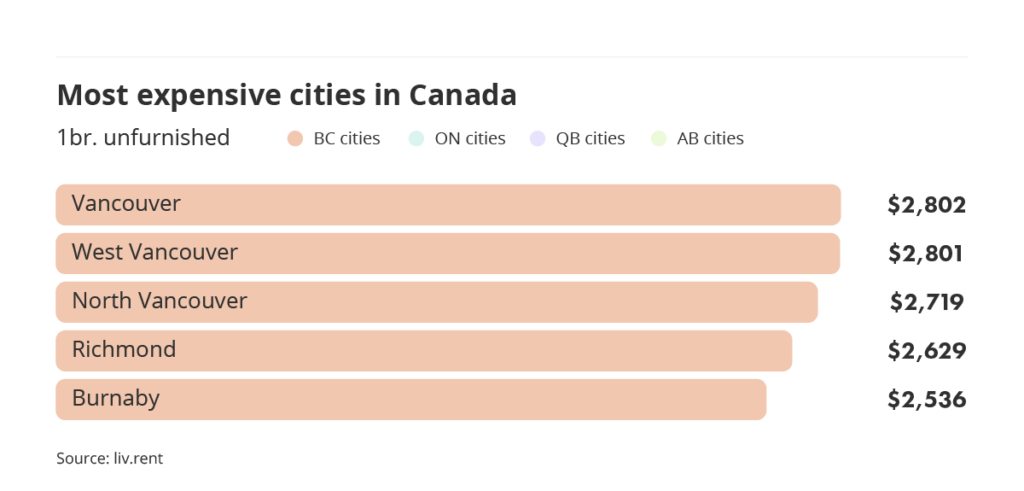
Most expensive cities in Canada
For now the fifth consecutive month, all five of Canada’s most expensive cities to rent in are in Metro Vancouver. Vancouver retains the top spot as the country’s most expensive place to rent, with West Vancouver just $1 behind. North Vancouver and Richmond also make the list, with Burnaby rounding out this month’s most expensive cities to rent in.
>> Recommended Reading: The 12 Cheapest Neighbourhoods For Rent In Metro Vancouver
Other rental data
These insights are exclusive to our blog and are intended to give more context to each month’s rental data. Based on data sourced directly from liv.rent, these statistics provide a more comprehensive overview of the current rental situation in Canada.
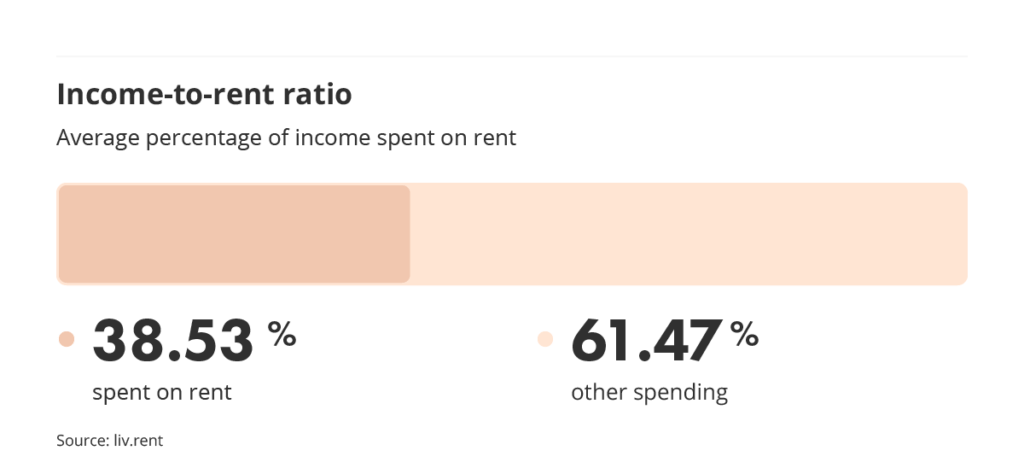
Income-to-rent ratio
Each month, we gather data on renters’ income-to-rent ratio and our most recent data shows that renters in Vancouver who use liv.rent are paying, on average, 38.53% of their income towards rent. This may be considerably above the recommended amount but isn’t an anomaly given the past few months’ average rental rates.
While traditional financial advice would be to spend no more than 30% of your income on rent, this advice is perhaps not well suited to the realities of renting in cities like Vancouver – especially as prices continue their rapid climb due to Canada’s high interest rates and increased demand this September.
Still, landlords and property managers should look to see that a tenant can reasonably afford rent compared to how much money they make as part of their tenant screening process.
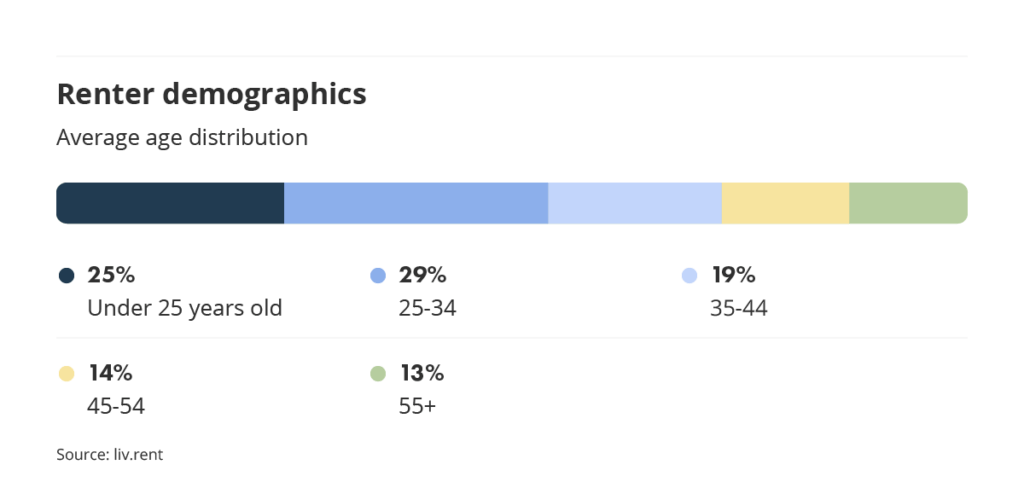
Renter demographics
On liv.rent, our renter demographics are fairly balanced across all different age groups. While the majority of users are still aged 25-34, we’ve been seeing more and more younger renters under 25, as well as increases in users over 35 years of age.
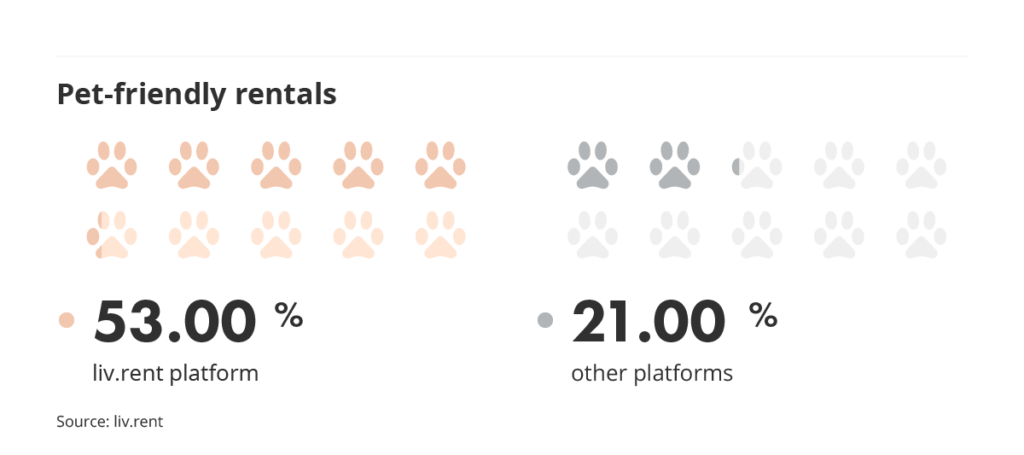
Pet-friendly rentals
We’re proud to say that liv.rent continues to be the rental platform with the most pet-friendly rentals. This September, other rental platforms have just 23.00% of units available that were pet-friendly while on liv.rent, 53.00% of all listed units were pet-friendly.
>> Recommended Reading: The Top 8 Pet Friendly Neighbourhoods in Metro Vancouver
Downloadable resources


Make Zoom calls fun and informative when you use the latest rental averages and trends as your virtual background.
Free Virtual Backgrounds
Download the latest Vancouver rental stats and use as your zoom background.
Download The Latest Vancouver Rent Report
For the complete Vancouver rent report including new neighbourhood breakdowns, download here.
Rental resources for B.C. renters
You can read these comprehensive guides for more information on renting in B.C. and using liv.rent to streamline your rental process.
- BC Residential Tenancy Agreement Explained
- Guide to BC Tenancy Forms
- The Complete User Guide To liv.rent For Landlords & Property Managers
- The Ultimate Renter’s Guide To Using liv.rent
Data collection methodology
Our monthly rent reports use data from our own liv.rent listings, as well as data our team manually collects from other popular listing sites – looking at available basement suites, apartments, condos, townhouses, semi-detached houses, and single-detached houses for each area.
When collecting this data, we do exclude luxury properties listed at over $5,000, as well as rooms for rent and shared accommodation. Investing in manual data collection means that we only consider the current month’s listing, since we can filter out duplicate listings and older ads that haven’t been removed.
Another key difference between our data collection methods and some government agencies like the CMHC is that we only include current asking rent prices. Many official reports will include data for entire buildings in their reports, which tends to skew numbers lower since many units are already occupied, and may be rent-controlled or rented for significantly lower than the current rates.
As we are a Canadian rental platform founded and based in Vancouver, we want to ensure that we’re providing a completely accurate depiction of the rental market in the cities we look at.
Rethink The Way You Rent
Not on liv.rent yet? Experience the ease of digital applications & contracts, verified tenants & landlords, virtual tours and more – all on one platform. Sign up for free or download the app.
Subscribe to receive these monthly updates on the Vancouver rental market. Discover last month’s Rent Reports below:
August 2023 Metro Vancouver Rent Report
August 2023 Toronto Rent Report
August 2023 Calgary & Edmonton Rent Report
August 2023 Montreal Rent Report


0 Comments