

At a glance
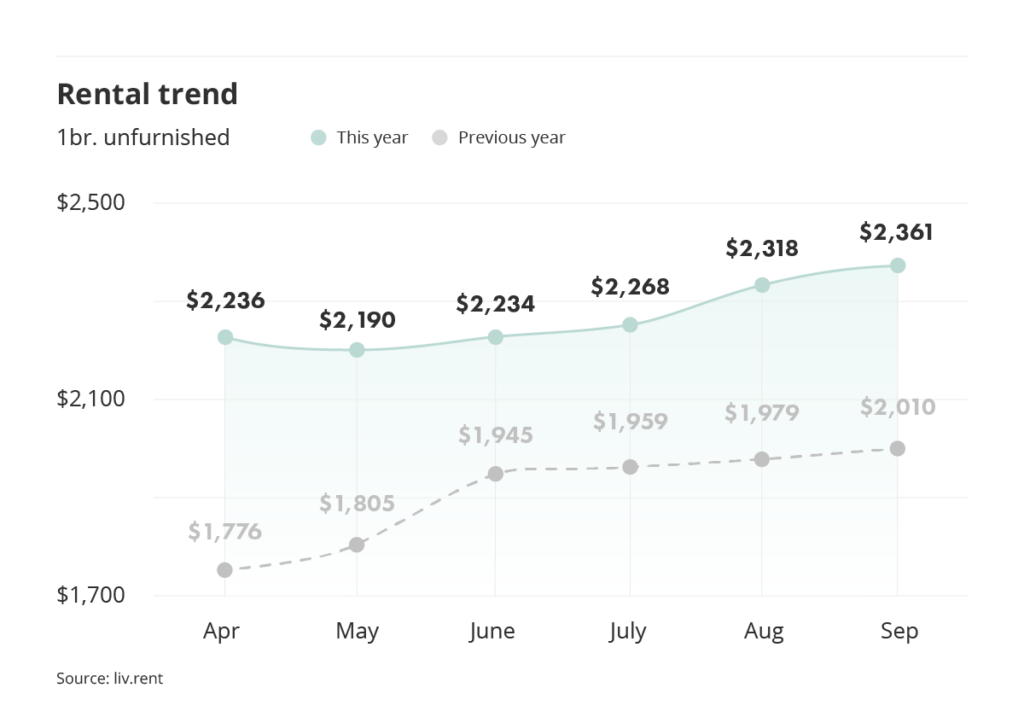
- The Greater Toronto Area’s average monthly rate for a one-bedroom, unfurnished unit has increased by $43 this September – to $2,361. Since September 2022, the region’s average rent prices have risen by $351.
- Downtown Toronto had the most expensive average rent prices in the region for all listing types this month.
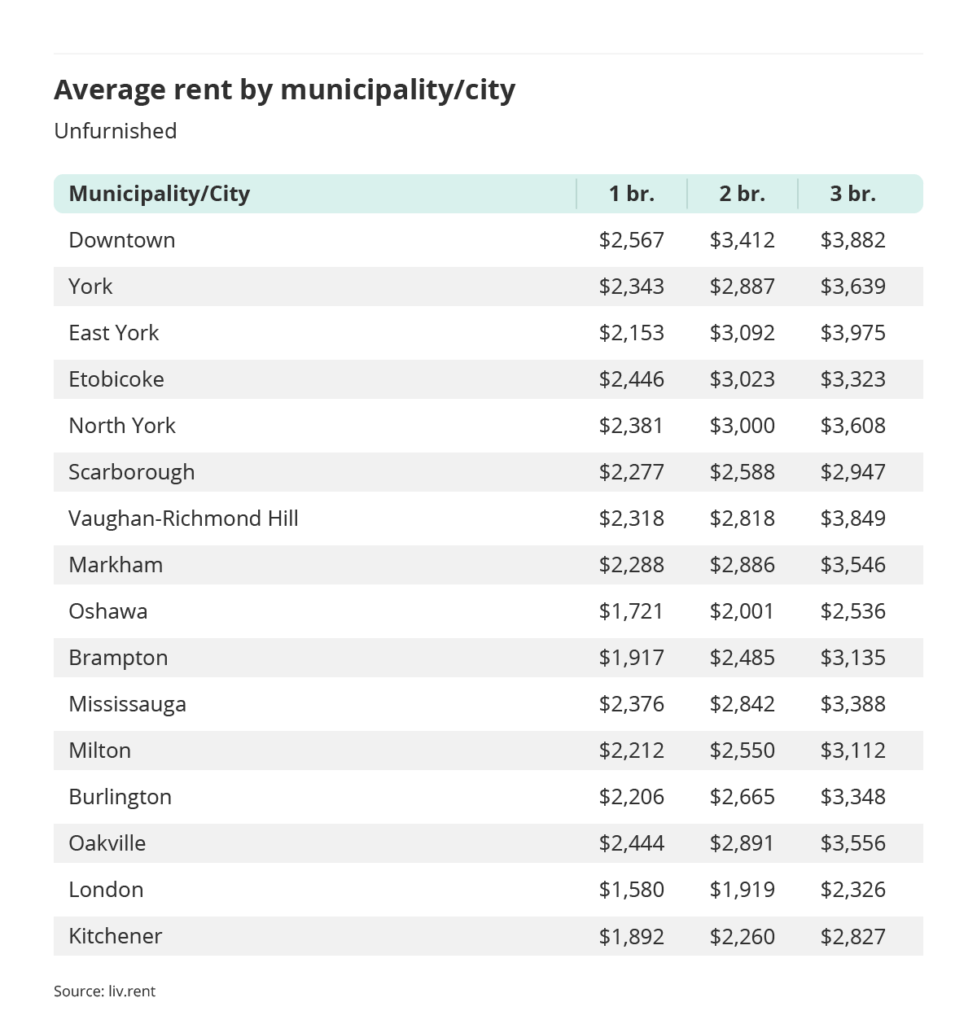
- Oshawa has the lowest average rent prices in the GTA this September, at $1,721 per month for an unfurnished, one-bedroom unit compared to $2,567 in Downtown Toronto.
Looking for our full September 2023 Toronto Rent Report? Download your copy here to get all the latest insights, including a detailed breakdown by neighbourhood.
Is your rental priced competitively?
Find out with a free rent estimate. Our team of rental experts will calculate your unit’s true value based on your listing details & current market trends.
Average monthly rent prices in the Greater Toronto Area have risen for the fourth consecutive month this September. As of this month, the GTA’s region-wide average monthly rent price for an unfurnished, one-bedroom unit now stands at $2,361, a $43 increase since August. Despite the Bank of Canada holding the country’s interest rates at their current levels, demand for rental housing remains high heading into the fall and winter which could keep rates high throughout the remainder of 2023.
We’ve published our 2022 Canada-wide Annual Rent Report with even more rental data and statistics, including overarching trends and predictions for the year ahead. You can download your copy here.
Let’s take a look now at the latest data and see which neighbourhoods are experiencing the biggest changes in furnished and unfurnished rental rates.
Download The Latest Toronto Rent Report
For the complete Toronto rent report, download here.
Toronto rent trends
Average rent prices for unfurnished, one-bedroom units in Toronto have increased for the fourth straight month, rising by another $43 to maintain a steady upward trend for the region’s rent prices. Looking at a year-over-year comparison, the average monthly rent for an unfurnished, one-bedroom unit in the GTA has increased by $351 since September 2022.
Planning on raising rent this year? Ontario’s Annual allowable rent increase limit for 2024 is 2.5%. Find out when and how you can increase rent and ensure you’re complying with provincial guidelines by reading our updated Guide to Ontario Rent Increases.
>> Recommended Reading: What is Ontario’s maximum allowable rent increase?
Is your rental priced competitively?
Find out with a free rent estimate. Our team of rental experts will calculate your unit’s true value based on your listing details & current market trends.
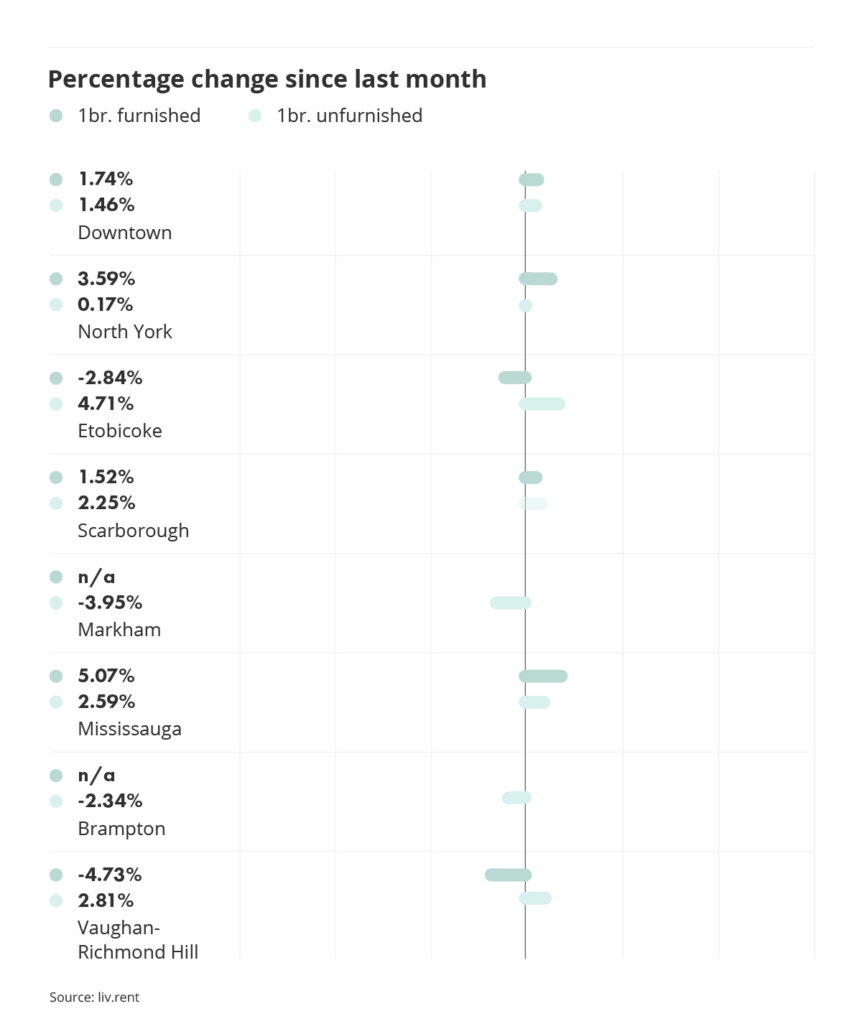
Month-to-month rent change
This chart breaks down the percentage change in rent across all GTA cities/municipalities between August and September 2023.
Unfurnished Toronto rent trends
Average rent prices for unfurnished units in the GTA didn’t fluctuate much this September. Among the most notable shifts, the largest increases were seen in Etobicoke (+4.71%), Vaughan-Richmond Hill (+2.81%), and Mississauga (+2.59%). The only month-to-month declines occurred in Markham (-3.95%) and Brampton (-2.34%).
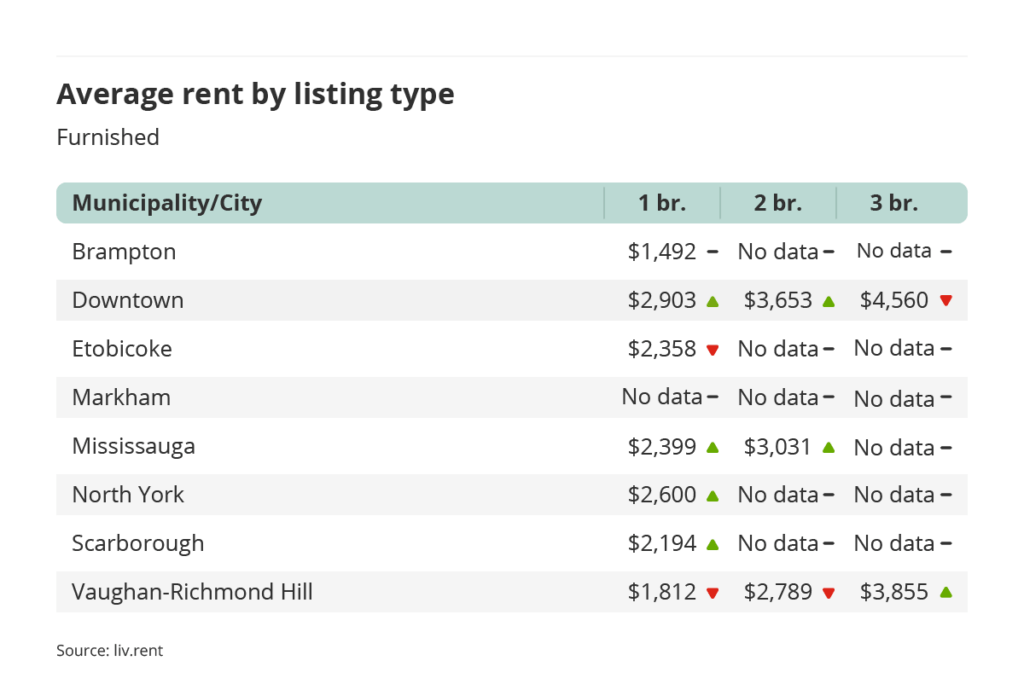
Furnished Toronto rent trends
Furnished units were also fairly stable this month, as a whole. The most significant increases occurred in Mississauga (+5.07%) and North York (+3.59%), while notable declines were seen in Vaughan-Richmond Hill (-4.73%) and Etobicoke (-2.84%).
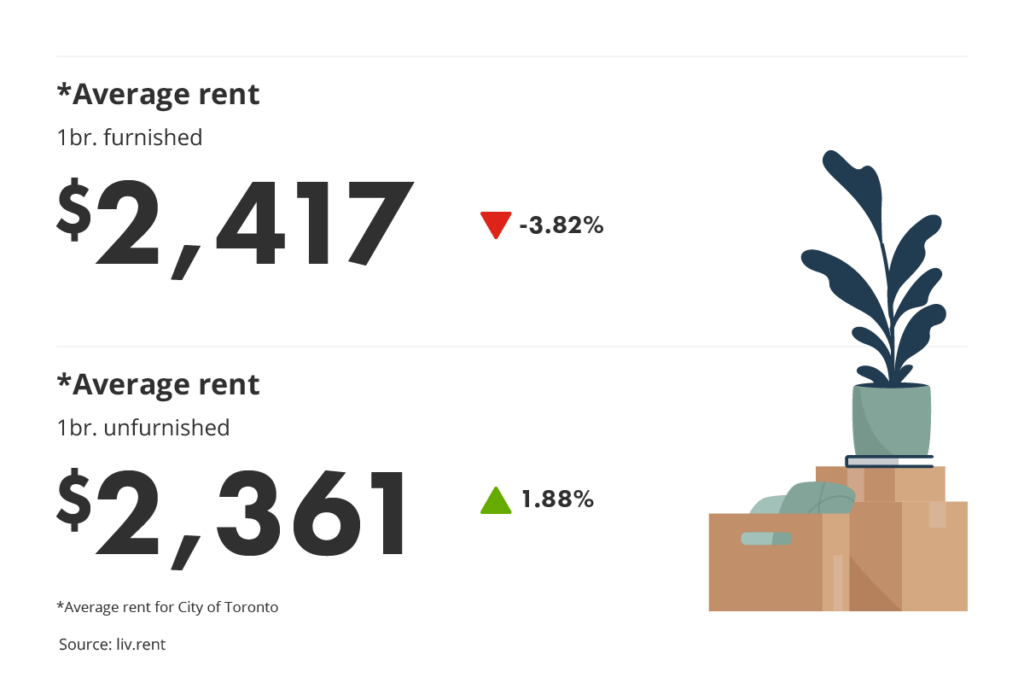
Toronto furnished vs unfurnished averages
This September, prices for furnished, one-bedroom units fell (-3.82%) across the GTA, while prices for unfurnished, one-bedroom units rose yet again (+1.88%). However, furnished units continue to rent for more than unfurnished ones, on average. This month, the average one-bedroom, furnished unit rents for just $56 more than a one-bedroom, unfurnished unit – meaning that landlords choosing to rent their units furnished can expect to earn marginally more profit over time, particularly if they decide to rent their units on a short-term basis. Renters who bring their own furniture will still see some savings in the GTA.
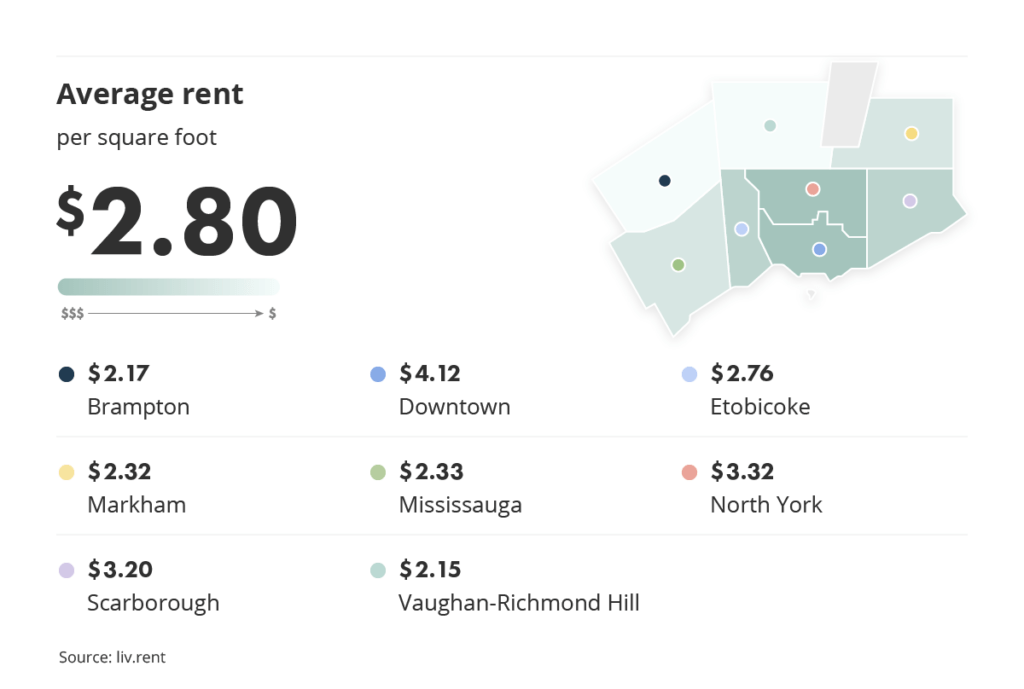
Rent per square foot
Our monthly Rent Reports also look more closely at average rent per square foot in municipalities throughout the Greater Toronto Area. This September, Downtown Toronto ($4.12/sq. ft.) has the most expensive rent in terms of cost per square foot, while North York ($3.32/sq. ft.) and Scarborough ($3.20/sq. ft.) also have relatively high average costs for space. This month, the least expensive average rent per square foot can be found in Vaughan-Richmond Hill ($2.15/sq. ft.).
Active listing data
We’ll also be looking at detailed statistics for currently active listings available on the market to see which property types and number of bedrooms are the most represented. For renters, these numbers show which types of units you’re most likely to encounter in the Greater Toronto Area, while for landlords, you can assess how much competition you’ll face based on the current supply.
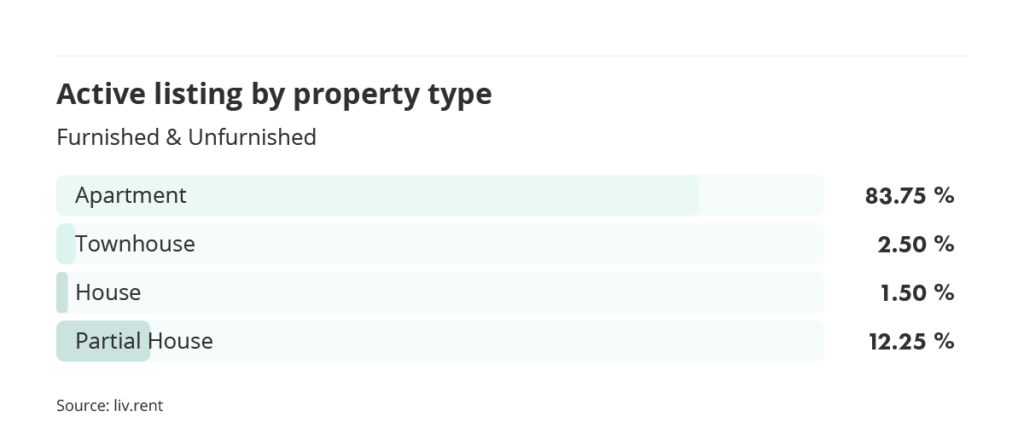
Active listings by property type
As of September 2023, the most common rental property type in the Greater Toronto Area was apartments, representing the vast majority of all listings in the area at 83.75%. Partial Houses (e.g. basement suites) were the second-most rented unit type this month, representing 12.25% of active listings.
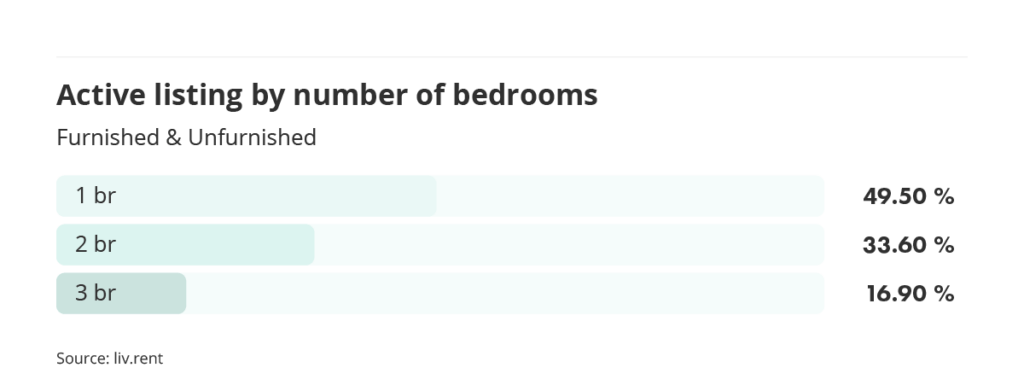
Active listings by number of bedrooms
In terms of the number of bedrooms, we saw a much more even spread across active listings on the market this month. One-bedroom units were the most common type of listing in the GTA this month at 49.50%, while two-bedroom units represented 33.60% of the region’s active listings.
City breakdown
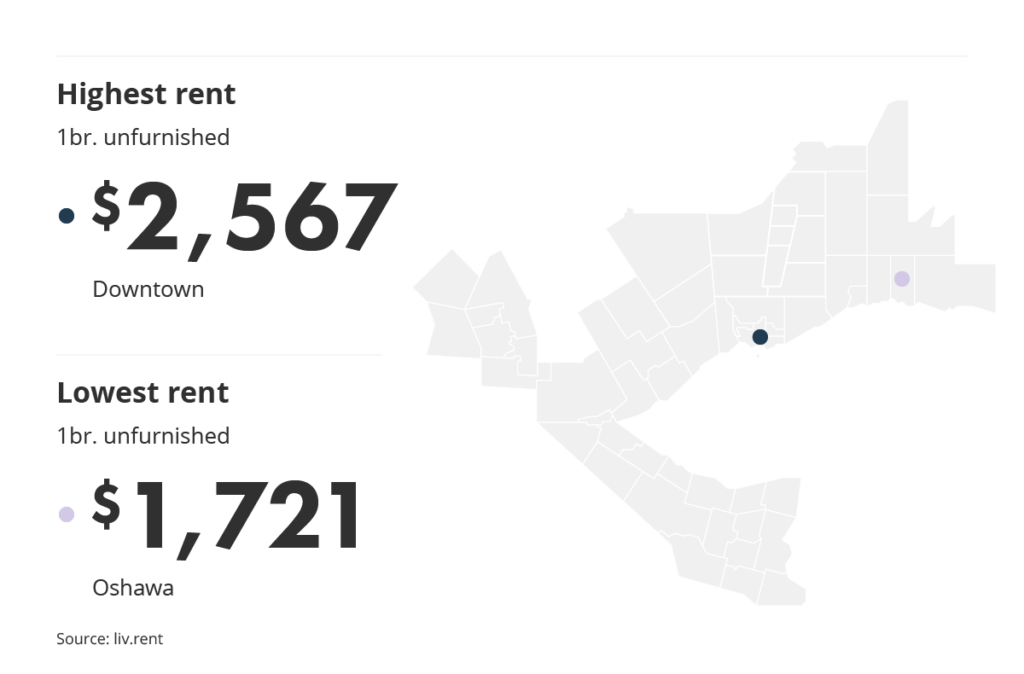
This September, Oshawa is still the cheapest municipality to rent in out of the areas we look at for our Rent Reports, and Downtown Toronto is unsurprisingly the region’s most expensive place to rent.
The average price for an unfurnished one-bedroom unit in Oshawa currently stands at $1,721, while in Dowtown Toronto, the same type of unit rents for an average of $2,567 – a difference of $846.
Read More: Rental Vacancy Rates In The City Of Toronto
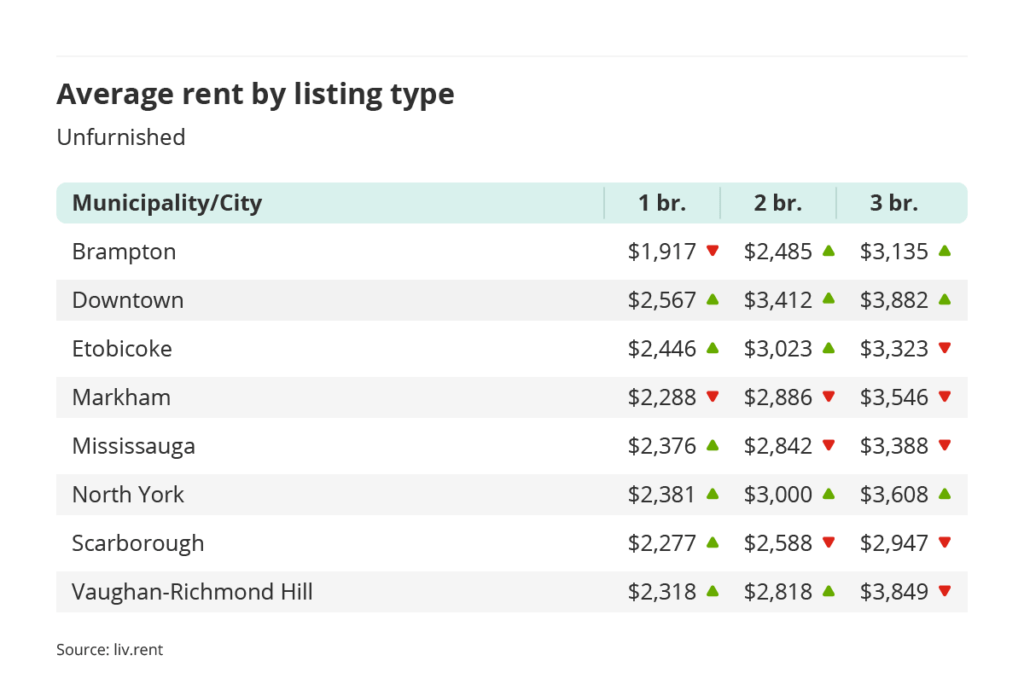
Because Ontario’s different communities are so diverse, we’re breaking down the GTA into its different cities and municipalities to see the price difference within listing types: one-bedroom, two-bedroom, and three-bedroom units, both unfurnished and furnished.
- This month, Downtown Toronto has the highest average monthly rent prices for all listing types.
- Average rent prices for unfurnished, one-bedroom units rose in every municipality except for Brampton and Markham.
- The least expensive type of rental unit this month was furnished, one-bedroom units in Brampton – which rented for an average of $1,492 per month.
Rental averages for other Ontario cities
We’ve explored data from other cities and municipalities in other regions within and surrounding the GTA. For these additional cities, London is the least expensive to rent in this September at $1,580 for an unfurnished, one-bedroom unit, while Downtown Toronto is the most expensive, at an average of $2,567 this month.
For complete data on these cities as well as other municipalities outside of the Greater Toronto Area, download our full report here to view the complete report.
Our complete September 2023 Rent Report has information on even more key areas, broken down into region and unit type for a complete overview of rental averages in Ontario. To view these and all the other new information we’ve added, be sure to download your copy of the Rent Report below.
Is your rental priced competitively?
Find out with a free rent estimate. Our team of rental experts will calculate your unit’s true value based on your listing details & current market trends.
Downloadable resources


Make a splash at your next video meeting and rep the latest rental averages and trends with our custom virtual backgrounds — always free to download.
Download The Latest Toronto Rent Report
For the complete Toronto rent report, download here.
Renting in Ontario
For more information on renting in Ontario, refer to these comprehensive resource posts:
- What’s A Standard Rental Application?
- What do you need when applying for a rental?
- What Can A Landlord Ask For On A Rental Application In Ontario?
- How Do I Fill Out A Rental Application?
- Ontario Standard Lease Explained
- Frequently Asked Questions: Everything You Need to Know About Eviction in Ontario
Data collection methodology
Our monthly rent reports use data from our own liv.rent listings, as well as data our team manually collects from other popular listing sites – looking at available basement suites, apartments, condos, townhouses, semi-detached houses, and single-detached houses for each area.
When collecting this data, we do exclude luxury properties listed at over $5,000, as well as rooms for rent and shared accommodation. Investing in manual data collection means that we only consider the current month’s listing, since we can filter out duplicate listings and older ads that haven’t been removed.
Another key difference between our data collection methods and some government agencies like the CMHC is that we only include current asking rent prices. Many official reports will include data for entire buildings in their reports, which tends to skew numbers lower since many units are already occupied, and may be rent-controlled or rented for significantly lower than the current rates.
As we are a Canadian rental platform founded and based in Vancouver, we want to ensure that we’re providing a completely accurate depiction of the rental market in the cities we look at.
Rethink The Way You Rent
Not on liv.rent yet? Experience the ease of digital applications & contracts, verified tenants & landlords, virtual tours and more – all on one platform. Sign up for free or download the app.
Subscribe to receive these monthly updates on the Vancouver rental market. Discover last month’s Rent Reports below:
August 2023 Metro Vancouver Rent Report
August 2023 Toronto Rent Report
August 2023 Calgary & Edmonton Rent Report
August 2023 Montreal Rent Report

0 Comments