


August 2026 Metro Vancouver rent report
At a glance
- Unfurnished one-bedroom rents declined across every Metro Vancouver city year-over-year
- All nine cities recorded lower unfurnished one-bedroom rents compared with August 2025, with declines ranging from 1.6% in Langley to 8.46% in Richmond. The average decline across the nine cities was approximately 4.7%.
- Burnaby is the only city where every rental category rose this month
- Burnaby recorded month-over-month increases across all six rental categories, furnished and unfurnished alike. Its largest gain was for furnished three-bedroom homes, which rose 4.74% from $3,046 to $3,190.
- Coquitlam’s furnished and unfurnished markets are moving in opposite directions
- Since July, Coquitlam’s furnished one-bedroom rents fell 1.21% from $2,051 to $2,026 and furnished two-bedroom rents fell 3.12% from $2,426 to $2,350. Over the same period, unfurnished one-bedroom rents rose 1.85% from $1,999 to $2,036, while unfurnished two-bedroom rents rose 0.63% from $2,403 to $2,418.
Download the latest Vancouver rent report
For the complete Vancouver rent report including neighbourhood breakdowns, download here.
Download liv.rent’s 2026 Canada rental market trends report for in-depth insights and forecasts on average rent prices, regional market comparisons, key economic drivers, and emerging AI trends shaping Canada’s rental landscape.
As of July 15, 2026, the Bank of Canada held its policy interest rate at 2.25%, the sixth consecutive hold. The next scheduled announcement is September 2, 2026. B.C.’s annual allowable rent increase limit for 2026 remains capped at 2.3%.
Let’s look now at the current rental costs and overarching trends in Vancouver for August 2026.
Average asking rent across Metro Vancouver
This month, the average asking rent for an unfurnished one-bedroom unit increased 0.45% from July, settling at $2,098 per month. Since August 2025, the Metro Vancouver-wide average for an unfurnished one-bedroom has decreased 4.86%, a drop of $107.
Planning on raising rent this year? B.C.’s annual allowable rent increase limit for 2026 is capped at 2.3%. Find out when and how to increase rent, and how to comply with provincial guidelines, by reading our updated guide to B.C. rent increases.
Recommended reading: Rent increase B.C. 2026: how much rent can your landlord increase?
Rental trend
Viewed across the year so far, unfurnished one-bedroom asking rents have held in a narrow band since January while remaining below the same months in 2025. The gap against last year continued to narrow in August, down to 4.86% from 6.43% in July.
Month-over-month rent change
To better understand how rent prices have shifted across Metro Vancouver cities, here are the most significant month-over-month movements for furnished and unfurnished one-bedroom units.
Among furnished one-bedroom units, West Vancouver recorded the largest increase at 3.94%, followed by Vancouver at 2.33% and Burnaby and Langley, both at 1.96%. Surrey posted the largest decrease at 3.80%, followed by Coquitlam at 1.21% and North Vancouver at 1.14%.
Among unfurnished one-bedroom units, North Vancouver recorded the largest increase at 3.59%, followed by Coquitlam at 1.85%. Richmond posted the largest decrease at 2.67%, followed by Langley at 1.05%.
Rent per square foot
Where is the most affordable place to rent in Metro Vancouver based on the space you get? As of August 2026, the average asking rent per square foot eased 0.35% from July to $3.14. The least expensive cities for square footage are Richmond, Coquitlam, and Langley. The most expensive are North Vancouver, Vancouver, and Burnaby.

Is your rental priced competitively?
Find out with a free rent estimate. Our team of rental experts will calculate your unit’s true value based on your listing details and current market trends.
Active listing data
We also examine detailed statistics for currently active listings on the market to see which property types and bedroom counts are most represented. For renters, these numbers show the types of units you are most likely to encounter across Metro Vancouver. For landlords, they indicate how much competition you face based on current supply.
Active listings by property type
As of August 2026, apartments were the most common rental property type on the market at 73.41% of active listings. Partial houses were the second most represented unit type this month at 15.91%, followed by houses at 6.81% and townhouses at 3.87%.

Active listings by number of bedrooms
Looking at bedroom counts, one-bedroom units were the most common listing this month at 46.69%, with two-bedroom units close behind at 42.54%. Three-bedroom units made up the remaining 10.77%.

Average unfurnished and furnished rates
Average prices for both furnished and unfurnished one-bedroom units increased across Metro Vancouver this month. Furnished one-bedrooms increased 0.34% to $2,181 per month, while unfurnished units increased 0.45% to $2,098. A furnished one-bedroom currently rents for $83 more per month than an unfurnished one on average.

Is your rental priced competitively?
Find out with a free rent estimate. Our team of rental experts will calculate your unit’s true value based on your listing details and current market trends.
Looking for our full August 2026 Metro Vancouver rent report? Download your copy in the downloadable resources section for all the latest insights, including a detailed breakdown by neighbourhood.
City breakdown
Rental averages vary widely across Metro Vancouver, so we break the data out by municipality to compare one-bedroom, two-bedroom, and three-bedroom rates for furnished and unfurnished units. Highlights from this month’s findings:
- All unfurnished unit types increased in price across Burnaby, Surrey, North Vancouver, and New Westminster.
- All furnished unit types increased in Vancouver and Burnaby. Richmond and Surrey also had complete furnished three-bedroom data this month, but not all furnished categories increased in those two cities.
- Coquitlam’s unfurnished rents are rising while its furnished rents fall: unfurnished one-bedroom rents increased 1.85% and two-bedroom rents increased 0.63%, while furnished one-bedroom rents decreased 1.21% and two-bedroom rents decreased 3.12%.
The table includes a year-over-year column comparing each city’s unfurnished one-bedroom asking rent with August 2025. Every city sits below where it was a year ago, with declines ranging from 1.6% in Langley to 8.46% in Richmond. The table is interactive: sort any column, or download it as an image.
Gain comprehensive insights about your listings with the liv.rent landlord listing dashboard. Sign in to see the average rent for a comparable property, the number of views your listing received, and more.
Neighbourhood breakdown
We break Vancouver down by neighbourhood for a more complete picture of the city’s rental markets. For neighbourhood detail in municipalities outside Vancouver, download the complete rent report.
Among City of Vancouver neighbourhoods with available unfurnished one-bedroom data, West Point Grey and UBC is the most expensive this month at $2,741 per month, while Sunset and Victoria Fraserview is the most affordable at $1,802 per month.
We have added new neighbourhoods to our monthly reports that are not shown in the data below. For those additional neighbourhoods, furnished rental statistics, and neighbourhood breakdowns for other Metro Vancouver cities, download your copy of the full report in the downloadable resources section.

Most expensive cities in Canada
This August, four of the country’s five most expensive cities are again in Metro Vancouver, though the lineup has shifted since July: Burnaby has entered the top five in place of Richmond. West Vancouver claims the top spot as the most expensive city in Canada to rent in, followed by North Vancouver, Vancouver, and Burlington, Ontario, with Burnaby rounding out the top five.
*Based on a smaller sample of listings.

These insights are exclusive to our blog and give more context to each month’s rental data. Based on data sourced directly from liv.rent, these statistics provide a broader view of the current rental situation in Canada.
Renter demographics
liv.rent renters span several age groups, with the largest share aged 35 to 44 at 38%, followed by renters aged 25 to 34 at 24%. Renters aged 45 to 54 account for 15%, renters under 25 account for 12%, and renters aged 55 and older account for 11%.

Pet-friendly rentals
liv.rent continues to be the rental platform with the most pet-friendly rentals. This August, 24% of units on other rental platforms were pet-friendly, compared with 55% of all units listed on liv.rent.

Recommended reading: The top 8 pet-friendly neighbourhoods in Metro Vancouver
Downloadable resources
Download the latest Vancouver rent report
For the complete Vancouver rent report including neighbourhood breakdowns, download here.
Rental resources for B.C. renters
These comprehensive guides cover renting in B.C. and using liv.rent to streamline your rental process.
- B.C. residential tenancy agreement explained
- Guide to B.C. tenancy forms
- The complete user guide to liv.rent for landlords and property managers
- The ultimate renter’s guide to using liv.rent
Data collection methodology
Our monthly rent reports use data from our own liv.rent listings, as well as data our team manually collects from other popular listing sites, covering available basement suites, apartments, condos, townhouses, semi-detached houses, and single-detached houses for each area.
When collecting this data, we exclude luxury properties listed at over $5,000, as well as rooms for rent and shared accommodation. Investing in manual data collection means we consider only the current month’s listings, since we can filter out duplicate listings and older ads that have not been removed.
Another key difference between our data collection methods and those of agencies such as the Canada Mortgage and Housing Corporation is that we include only current asking rent prices. Many official reports include data for entire buildings, which tends to skew numbers lower since many units are already occupied and may be rent-controlled or rented well below current rates.
As a Canadian rental platform founded and based in Vancouver, we want to provide a completely accurate depiction of the rental market in the cities we cover.
Rethink the way you rent
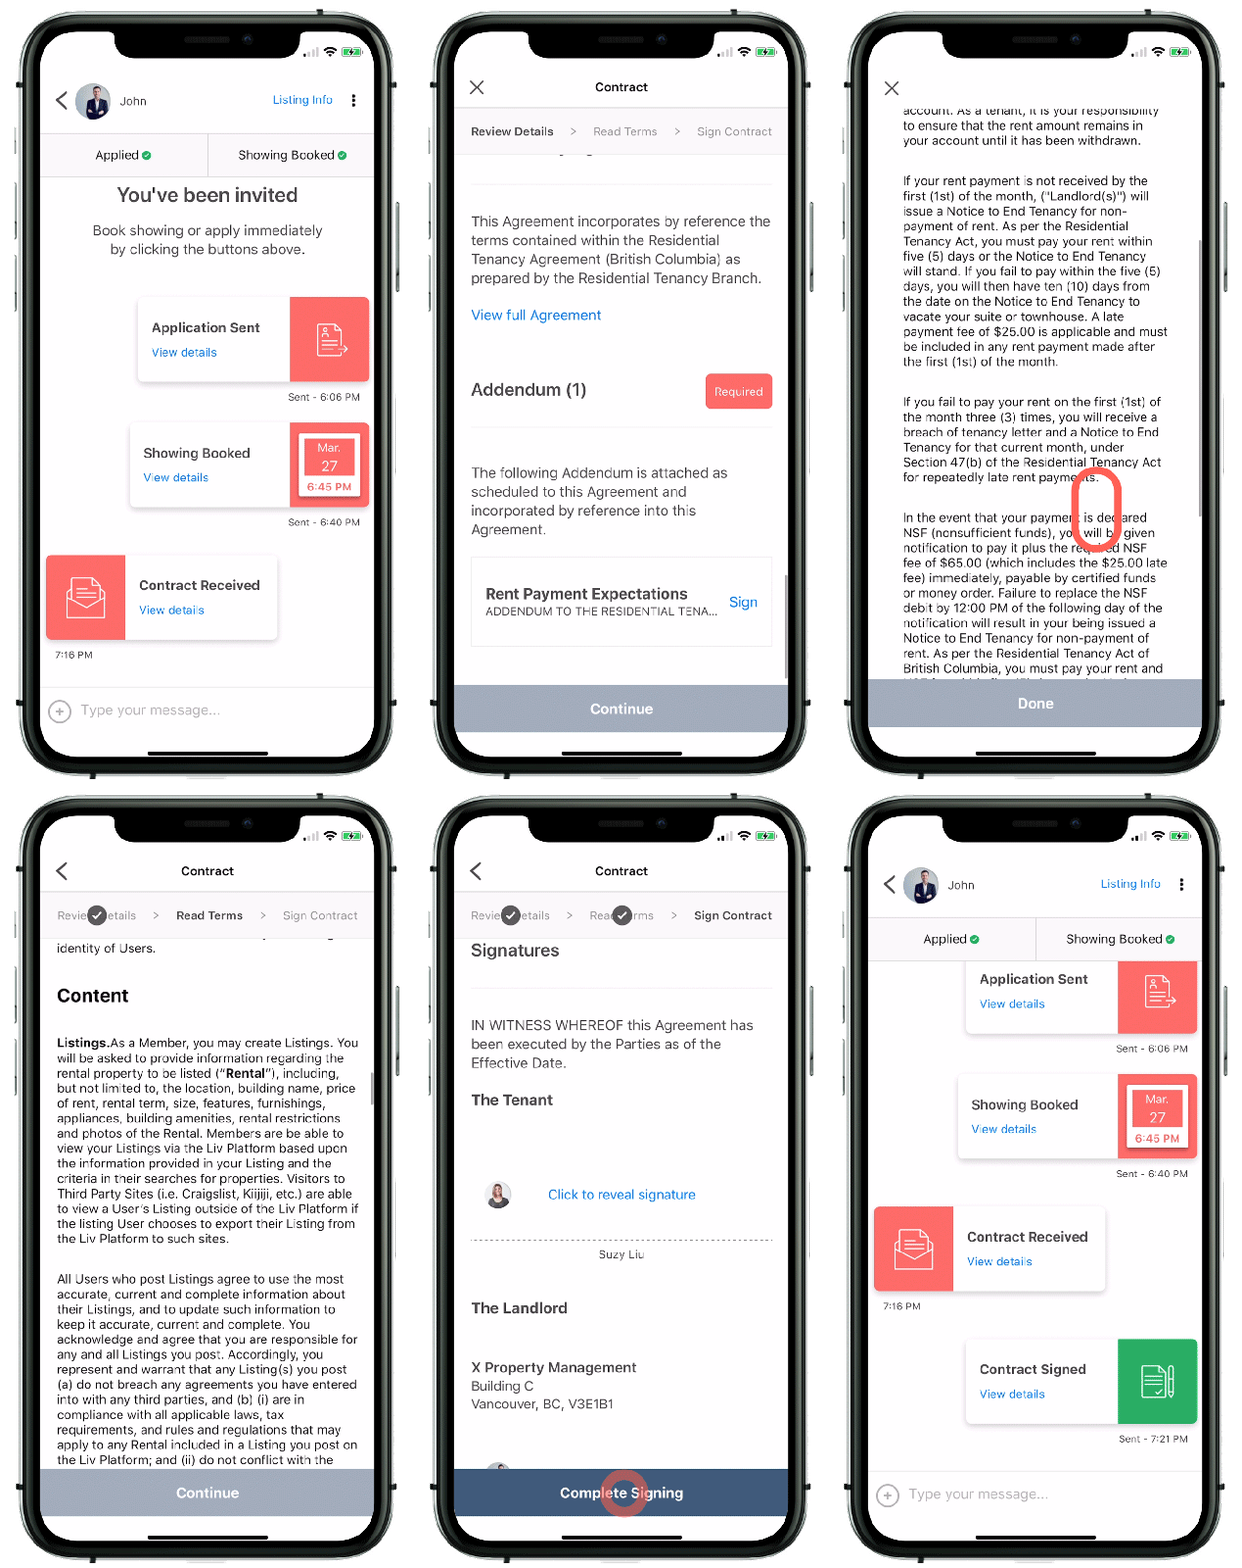
Not on liv.rent yet? Experience the ease of digital applications and contracts, verified tenants and landlords, virtual tours, and more, all on one platform. Sign up for free or download the app.
Subscribe to receive monthly updates on Canada’s major rental markets. Discover last month’s rent reports below:
Vancouver rent report
Ontario rent report
Montreal rent report
Calgary and Edmonton rent report

0 Comments