Rental Trends in June 2021
June has arrived in Vancouver and with it comes a new sense of optimism for the future. Folks are getting vaccinated, shops and restaurants are slowly returning to business as usual, and we’re now officially halfway through 2021 which has been yet another challenging year for the city. Even liv.rent is excited for the future, especially after our pay by bitcoin feature launch this month. Riding this wave of optimism, let’s see our June rental data for Metro Vancouver that shows exactly how rent is changing month by month this year.
You can get the latest updates on the Vancouver rental market straight to your inbox when you subscribe to keep on top of the latest rent trends.
Our monthly rent reports share key market data to supports our community of tenants and landlords. This data was manually gathered both from our own platform and other listings websites. Knowing the latest rental averages helps tenants navigate the rental landscape while helping landlords price their units according to the market.
Let’s look at the real cost of rent in Metro Vancouver in June 2021. Plus, you can also download a one-pager PDF to review it at a glance and share it with your friends.
Jump to the following Vancouver Rent Report sections:
Complete June 2021 Vancouver Rent Report: Download Here
Average rent across Metro Vancouver
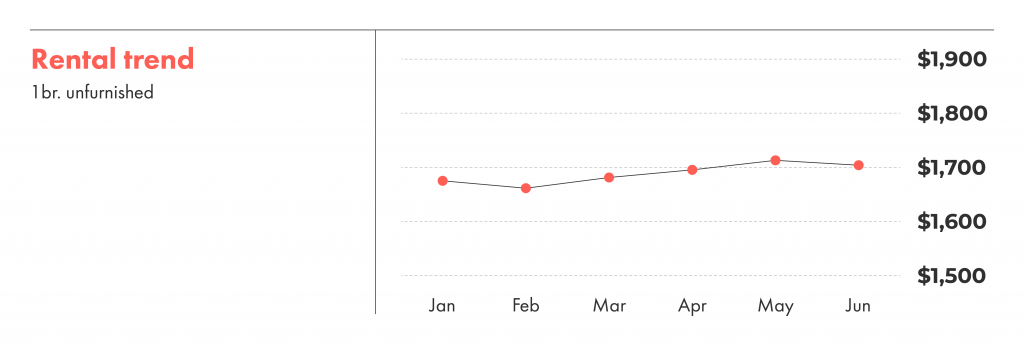
Taking a look at the last six months, it’s clear that rent has risen since January, but from May to June it’s more or less holding steady. The average rent for an unfurnished one-bedroom apartment is $1,704 in June when in May, it was $1,713.
Month-to-month rent change
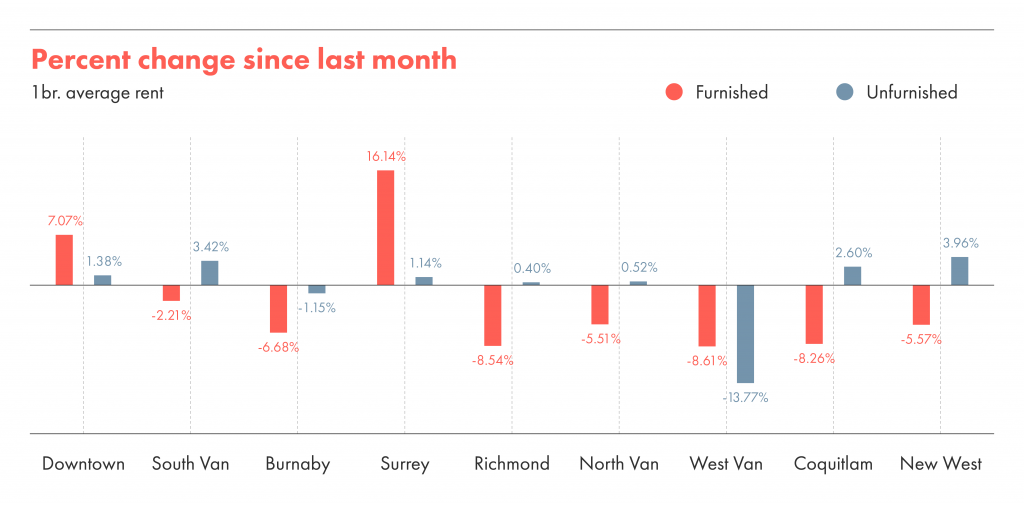
In Vancouver, Downtown unfurnished rents went up (+1.38%) and in South Vancouver, rents were also up (+3.42%)
Unfurnished rent in West Vancouver dropped dramatically 13.77% after last month’s skyrocketing increase of 15%. Across most of Metro Vancouver, there was only a slight increase in unfurnished rent across the board, the largest increase being in New Westminster (+3.96%.)
Regarding furnished rent, it dropped in most places except for in Downtown Vancouver (+7.07%) and Surrey (16.14%.)
>> Read More: How To Pay For Rent With Bitcoin On liv.rent
Income-to-rent ratio
Our income-to-rent ratio data shows that renters in Vancouver are paying on average 33.35% of their income on rent.
Property managers and landlords want to find renters who can afford to pay about 30% of their income on rent, the generally accepted standard percentage of income that should be spent on housing. Of course, in a city like Vancouver, this isn’t always possible, and it’s still a good metric to consider when you’re applying for homes or screening tenants.

Rent per square foot
Rent per square foot is a helpful metric to show where the cheapest place to rent in Metro Vancouver is if you want room to roam.
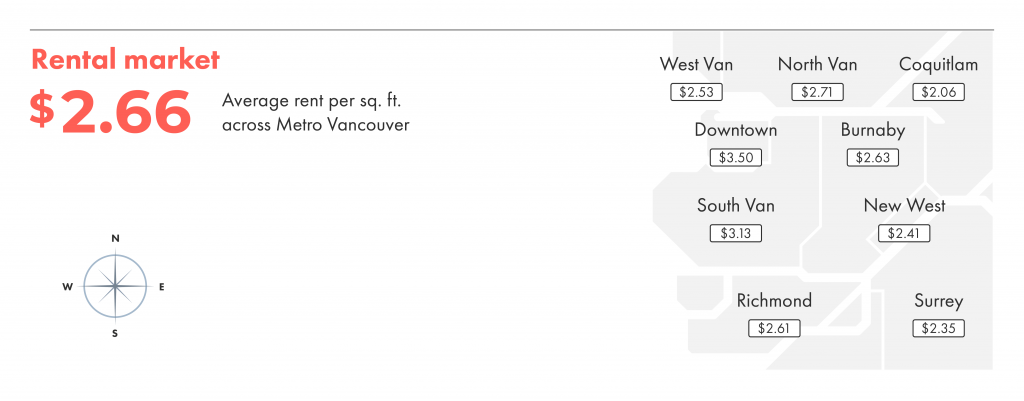
Overall, the average rent per square foot across Metro Vancouver was $2.66 per square foot, down from $2.70 in May.
Savings abound in Coquitlam which offers the most space per dollar at $2.06 per square foot. The most expensive spot is Downtown where each square foot can cost $3.38 on average.
>> Read More: Vancouver vs. Surrey: Cost of Living Comparison
Renter demographics
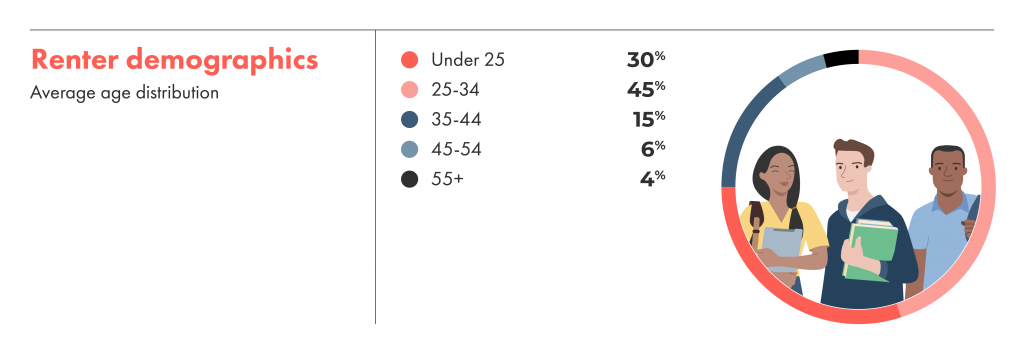
The under 25 contingent of renters on liv.rent has grown since May from 24% to 30% of our users.
The 25 to 34 group continues to be our largest user base but we continue to see users 45+ as well.
liv.rent – Canada’s trusted house & apartment rental website
Search apartments, condos, and homes for rent.
Pet-friendly rentals
liv.rent has more pet-friendly rentals than any other platform, with more than a third (36%) of listings open to pets in June.
Typically, other platforms have fewer pet-friendly rentals, and in June, 29% of their listings allowed pets.

Average unfurnished vs. furnished rates
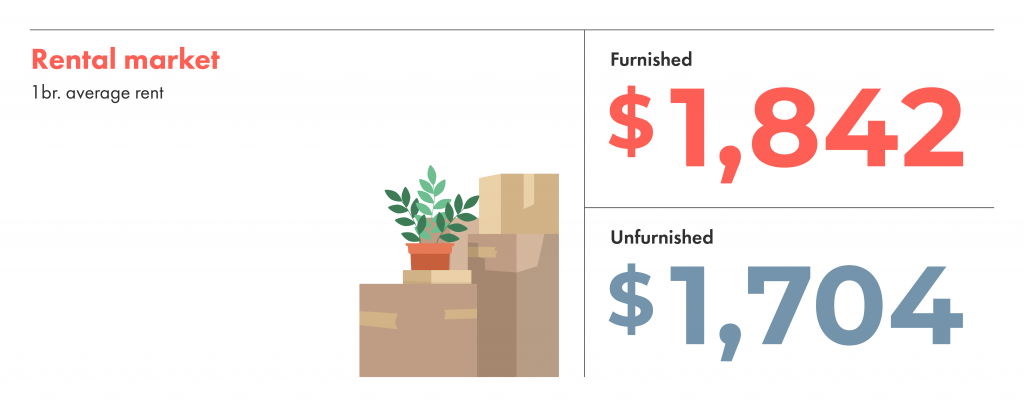
The average rent for a furnished one-bedroom in Vancouver is $1,842. For the same listing type that’s unfurnished, rent was $1704 on average, which is a difference of $138.
>> Read More: Neighbourhood Guide: Richmond BC
Neighbourhood breakdown
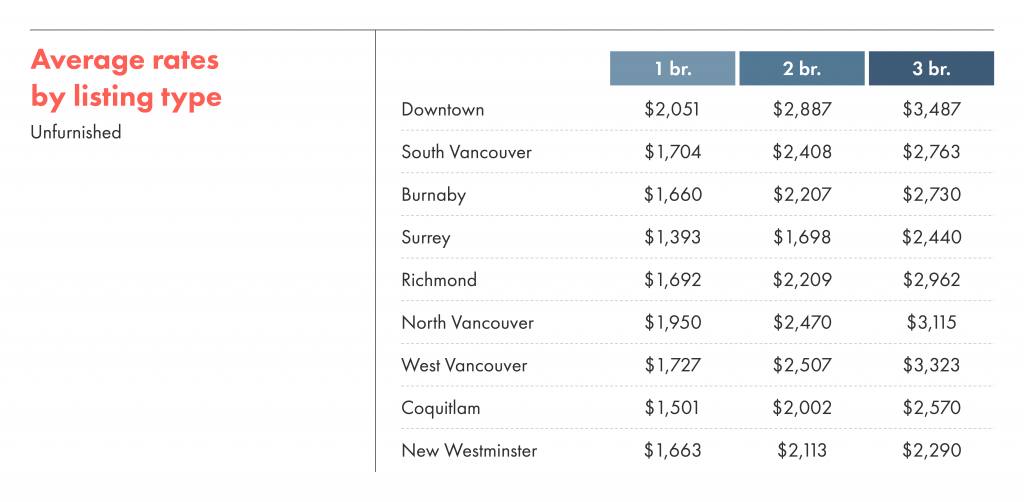
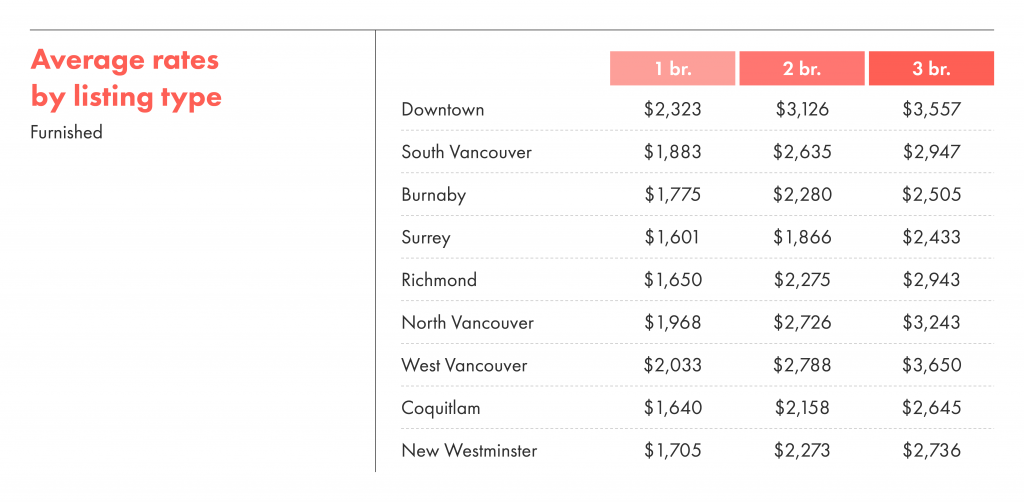
Because the region of Metro Vancouver is so varied, we broke up the average rent in each neighbourhood to give you the clearest, most accurate look at the cost of rent by comparing one, two, and three-bedroom rates for both furnished and unfurnished units.
Living in Surrey means you may pay less for rent and an unfurnished one-bedroom apartment averages $1,393 per month. On the other hand, Downtown Vancouver fetches the highest rent prices at $2,041 for the same kind of apartment.
Gain comprehensive insights about your listings with the new liv.rent Landlord listing Dashboard. Sign in to unlock live insights – find out the average rent for a comparable property, number of views your listing received and more!
Most expensive cities in Canada
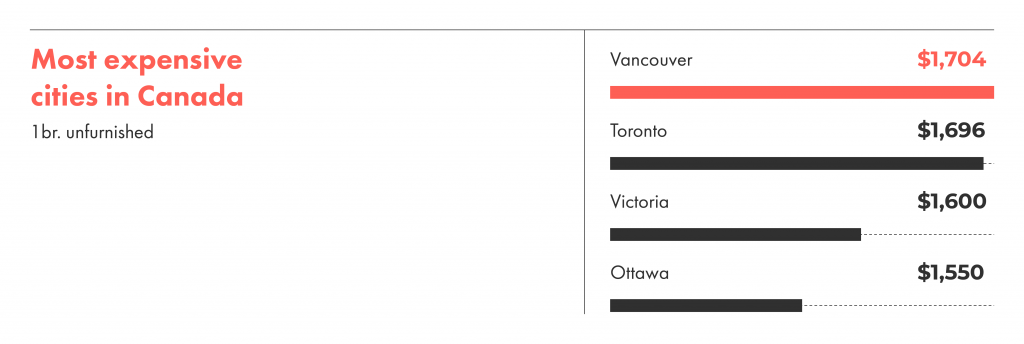
For most of 2021, Vancouver has been a more expensive city than Toronto for renters. In June, the average cost for an unfurnished one-bedroom apartment in Toronto is $1,696 and $1,704 in Vancouver.
>> Recommended Reading: Vancouver vs Toronto: Cost of Living Comparison
Downloadable resources
Impress at your next video conference by repping the latest rental averages and trends with our custom virtual backgrounds.
Free Virtual Backgrounds: Download Here
Looking for the full report? Download it for free below.
Complete June 2021 Vancouver Rent Report: Download Here

Rethink The Way You Rent
Not on liv.rent yet? Experience the ease of digital applications & contracts, verified tenants & landlords, virtual tours and more – all on one platform. Sign up for free or download the app.
Subscribe to receive these monthly updates on the Vancouver rental market. Discover last month’s Rent Reports below:
May 2021 Vancouver Rent Report
May 2021 Toronto Rent Report
May 2021 Montreal Rent Report
COVID-19 resources
For information about COVID-19 for landlords and tenants, you can check our comprehensive resource posts. They include information on the various federal and provincial assistance initiatives available to help support landlords (small business relief) and tenants (rent relief):
- BC Restart Plan: Guidelines for the Renting/Real Estate Industry
- Coronavirus (COVID-19) Canada – Support For Landlords
- Tips for Moving During the COVID-19 Pandemic
BC rental resources
For more information on renting in B.C., read these comprehensive guides to help you on your rental journey:


0 Comments