


At a glance
- Unfurnished one-bedroom rents declined across every Metro Vancouver city year-over-year
- All nine cities recorded lower unfurnished one-bedroom rents compared with July 2025, with declines ranging from 2.3% in Coquitlam to 10.1% in New Westminster. Across the nine municipalities, rents decreased by an average of approximately 6.5%.
- All nine cities recorded lower unfurnished one-bedroom rents compared with July 2025, with declines ranging from 2.3% in Coquitlam to 10.1% in New Westminster. Across the nine municipalities, rents decreased by an average of approximately 6.5%.
- Burnaby shows the most consistent signs of rental-market softness
- Burnaby rents declined across all six rental categories between January and July. Its largest start-of-year decrease was for furnished three-bedroom homes, which fell 12.4% from $3,476 to $3,046. Compared with July 2025, furnished three-bedroom rents were down approximately 20.2% from $3,815 to $3,046, the largest individual decline in the dataset.
- Burnaby rents declined across all six rental categories between January and July. Its largest start-of-year decrease was for furnished three-bedroom homes, which fell 12.4% from $3,476 to $3,046. Compared with July 2025, furnished three-bedroom rents were down approximately 20.2% from $3,815 to $3,046, the largest individual decline in the dataset.
- Surrey’s furnished rental market is outperforming its unfurnished market
- Since January, Surrey’s furnished one-bedroom rents increased 9.4% from $1,772 to $1,939, while furnished two-bedroom rents rose 9.6% from $2,106 to $2,309. By comparison, unfurnished one-bedroom rents increased only 1.2%, while unfurnished two-bedroom rents decreased 2.5%.
- Since January, Surrey’s furnished one-bedroom rents increased 9.4% from $1,772 to $1,939, while furnished two-bedroom rents rose 9.6% from $2,106 to $2,309. By comparison, unfurnished one-bedroom rents increased only 1.2%, while unfurnished two-bedroom rents decreased 2.5%.
Download The Latest Vancouver Rent Report
For the complete Vancouver rent report including new neighbourhood breakdowns, download here.
Download liv.rent’s 2026 Canada Rental Market Trends Report for in-depth insights and forecasts on average rent prices, regional market comparisons, key economic drivers, and emerging AI trends shaping Canada’s rental landscape.
As of July 15, 2026, the Bank of Canada held its target overnight rate at 2.25%, marking the sixth consecutive announcement with no change. Many economists expect the Bank to remain cautious through 2026 as inflation and economic uncertainty persist. B.C.’s 2026 rent increase limit is capped at 2.3%.
Let’s look now at the current rental costs and overarching trends in Vancouver for July 2026.
Average rent across Metro Vancouver
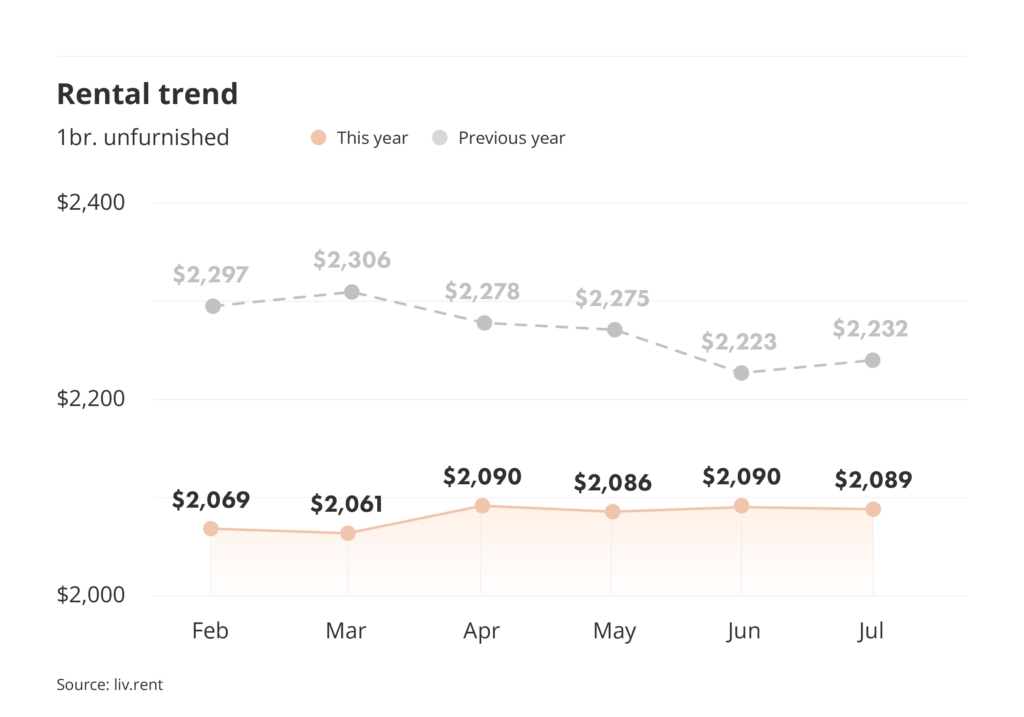
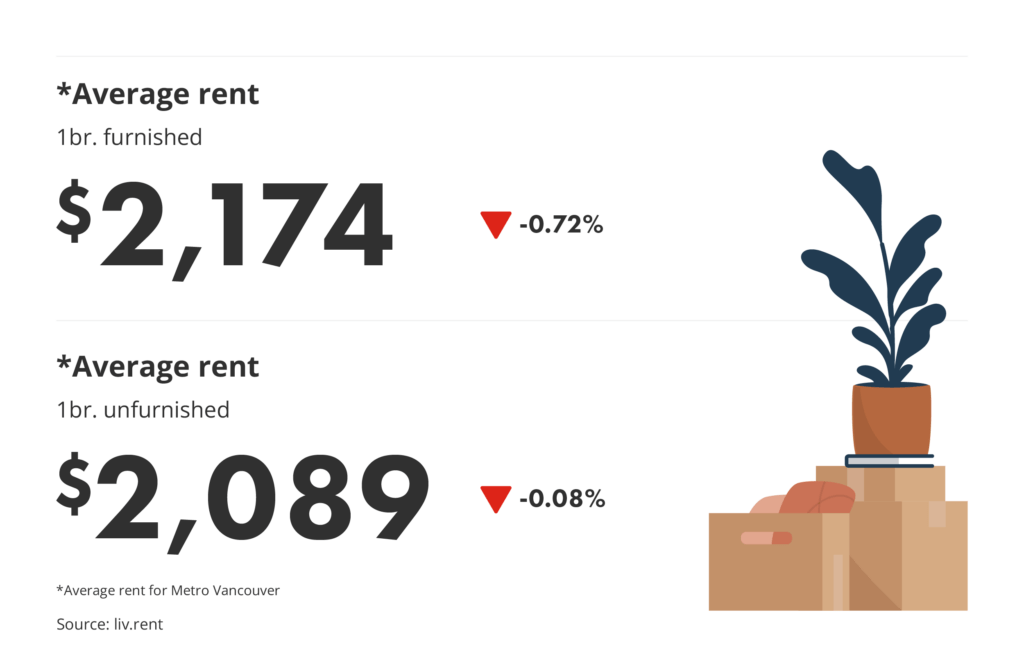
This month, the average rent price for an unfurnished one-bedroom unit decreased slightly to a new average of $2,089/month. Since July 2025, Metro Vancouver’s average rate for an unfurnished one-bedroom unit has decreased by $143.
Planning on raising rent this year? B.C.’s new annual allowable rent increase limit for 2026 is 2.3%. Find out when and how to increase rent and ensure you comply with provincial guidelines by reading our updated Guide to B.C. Rent Increases.
>> Recommended Reading: Rent Increase BC 2026: How much rent can your landlord Increase?
Month-to-month rent change
To better understand how rent prices have changed in Metro Vancouver cities, let’s look at the most significant changes for both furnished and unfurnished one-bedroom units this month.
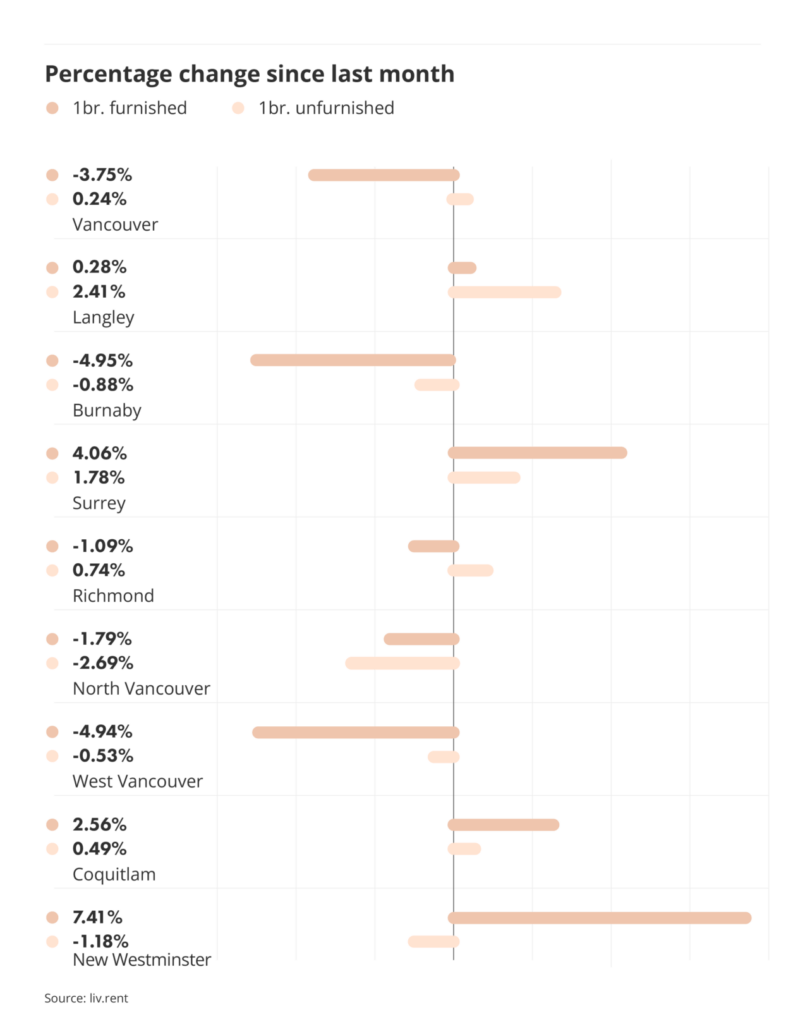
To better understand how rent prices have changed across Metro Vancouver cities, let’s look at the most significant month-to-month changes for furnished and unfurnished one-bedroom units. For furnished one-bedroom units, New Westminster (7.41%), Surrey (4.06%), and Coquitlam (2.56%) saw the most notable increases this month. Meanwhile, Burnaby (-4.95%), West Vancouver (-4.94%), and Vancouver (-3.75%) recorded the most notable decreases. For unfurnished one-bedroom units, Langley (2.41%) and Surrey (1.78%) saw the most notable increases, while North Vancouver (-2.69%) and New Westminster (-1.18%) recorded the most notable decreases.
Rent per square foot
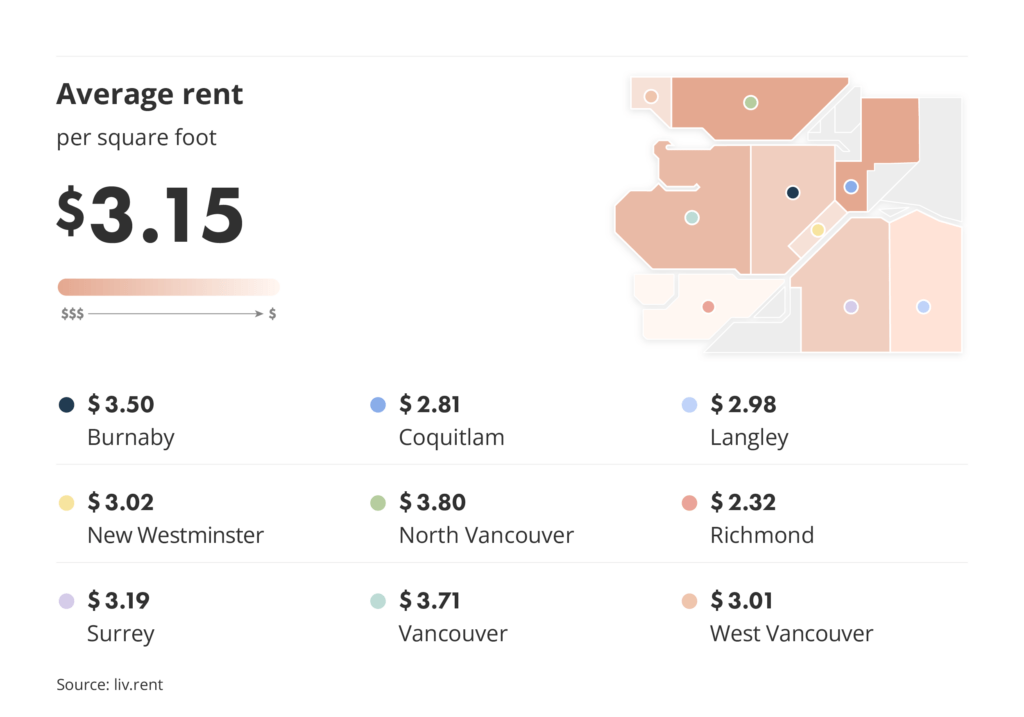
Where’s the cheapest place to rent in Metro Vancouver based on how much space you get? As of July 2026, the average rent per square foot decreased to $3.15/sq. ft. The least expensive cities for square footage are Richmond ($2.32/sq.ft.), Coquitlam ($2.81/sq.ft.), and Langley($2.98/sq.ft.) Meanwhile, the most expensive cities for square footage are North Vancouver ($3.80/sq. ft.), Vancouver ($3.71/sq. ft.), and Burnaby ($3.50/sq. ft.).
Is your rental priced competitively?
Find out with a free rent estimate. Our team of rental experts will calculate your unit’s true value based on your listing details & current market trends.
Active listing data
We’ll also examine detailed statistics for currently active listings available on the market to see which property types and number of bedrooms are the most represented. For renters, these numbers show which types of units you’re most likely to encounter in the Metro Vancouver region, while for landlords, you can assess how much competition you’ll face based on the current supply.
Active listings by property type
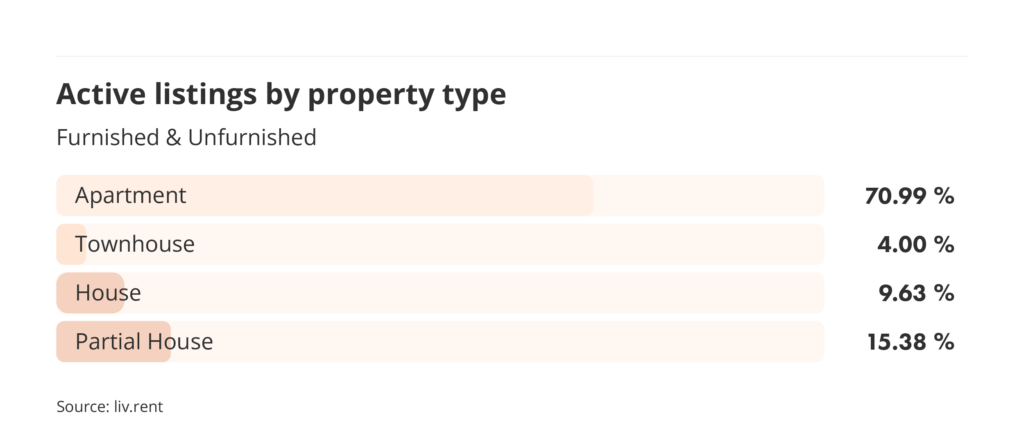
As of July 2026, apartments were the most common rental property type, representing 70.99% of active listings on the market. Partial houses were the second-most common listing type this month, at 15.38% of active listings currently available to rent, followed by houses at 9.63%.
Active listings by number of bedrooms
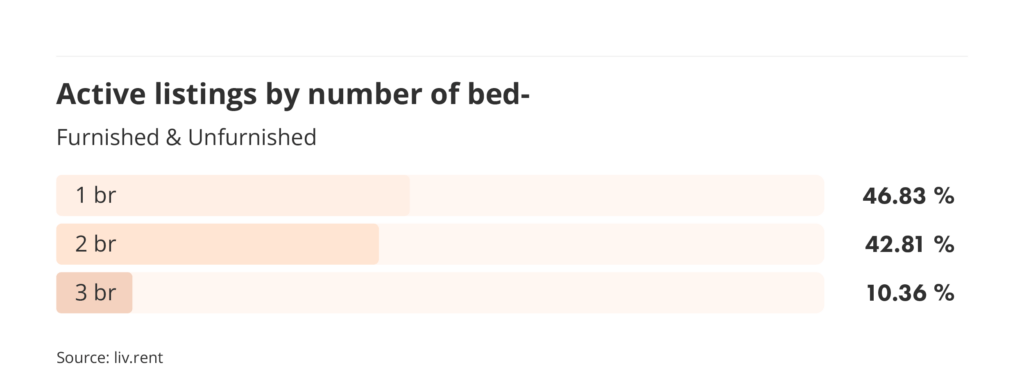
In terms of the number of bedrooms, we saw a spread across active listings on the market this July. One-bedroom units were the most common type of listing this month at 46.83%, though two-bedroom units held a very near share, representing 42.81% of all active listings on the market. Three-bedrooms rounded out at 10.36% of listings.
Average unfurnished vs. furnished rates
Average prices for both a furnished and unfurnished one-bedroom unit decreased in Metro Vancouver this month. Furnished one-bedrooms decreased (-0.72%) to $2,174/month, while unfurnished units decreased (0.08%) to $2,089/month. Currently, a furnished one-bedroom unit rents for more than an unfurnished one-bedroom unit by $85/month on average.
Is your rental priced competitively?
Find out with a free rent estimate. Our team of rental experts will calculate your unit’s true value based on your listing details & current market trends.
Looking for our full July 2026 Metro Vancouver Rent Report? Download your copy here to get all the latest insights, including a detailed breakdown by neighbourhood.
City breakdown
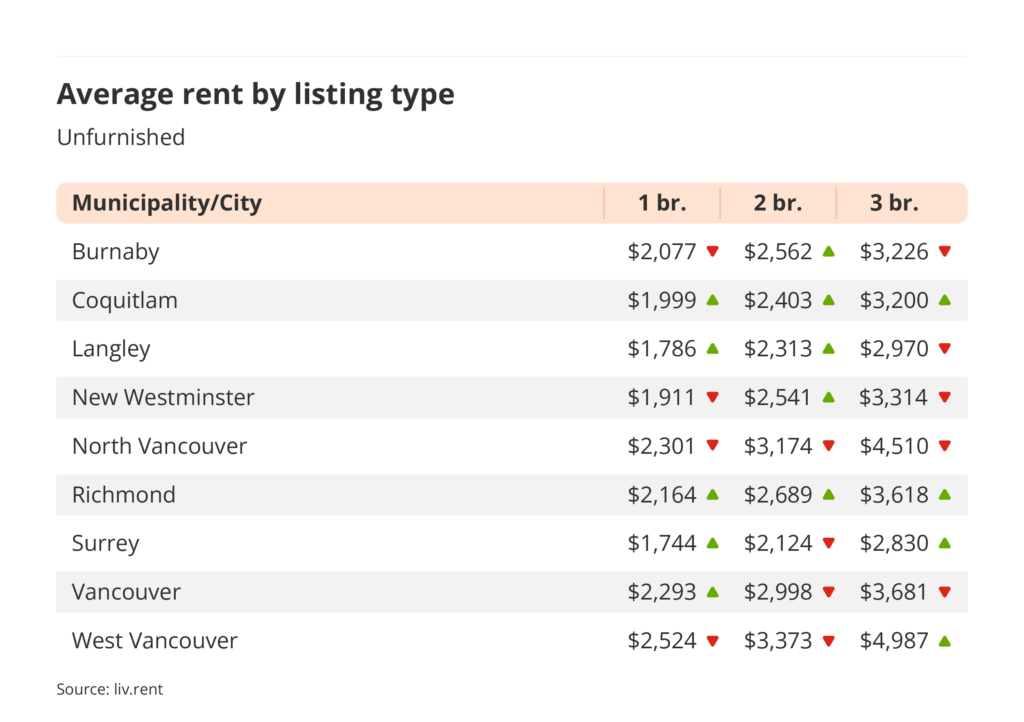
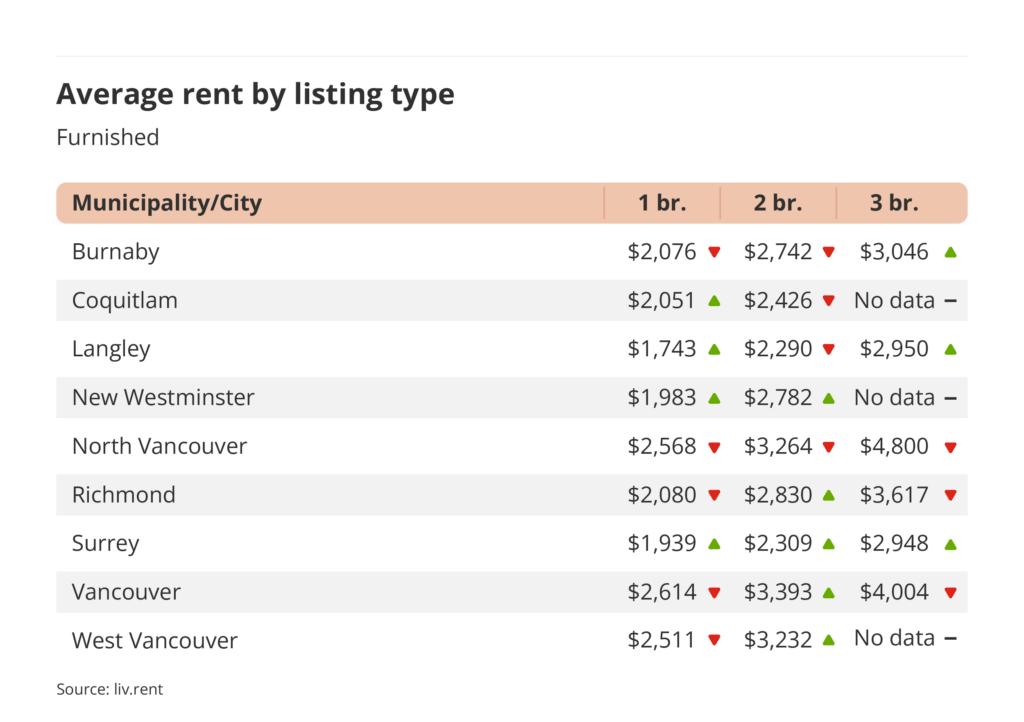
Metro Vancouver’s rental averages vary greatly across the region, so we’ve broken up our data by municipality/city to compare the cost of one-, two-, and three-bedroom rates for furnished and unfurnished units in different areas. Here are some highlights from our most recent findings:
- Coquitlam and Richmond were the strongest performers for unfurnished rentals this month, with one-, two-, and three-bedroom rents all increasing month over month.
- North Vancouver showed the clearest signs of softness among unfurnished rentals, with rents decreasing across all three bedroom types.
- Surrey stood out in the furnished market, as all furnished unit types increased in price this month.
Gain comprehensive insights about your listings with the new liv.rent Landlord listing Dashboard. Sign in to unlock live insights – find out the average rent for a comparable property, number of views your listing received and more!
Neighbourhood breakdown
We’ve broken down Vancouver into its neighbourhoods for a more complete look at the city’s rental markets. For a further breakdown of neighbourhoods in municipalities and cities outside of Vancouver, be sure to download our complete Rent Report.
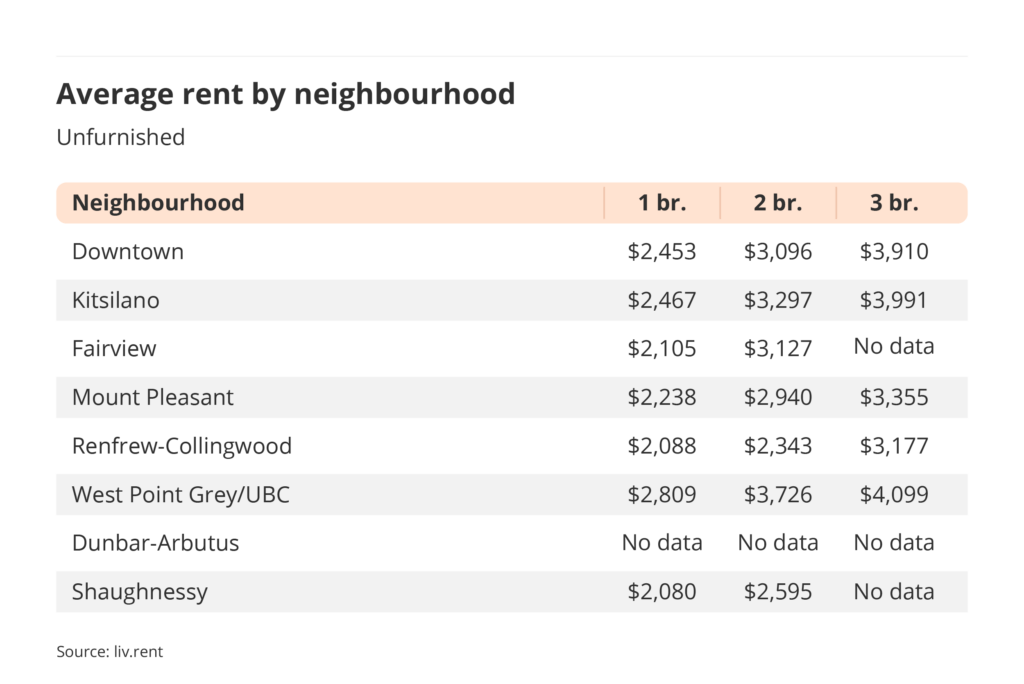
Let’s take a look now at some of the latest averages from Vancouver’s many unique neighbourhoods. West Point Grey/UBC is the city’s most expensive neighbourhood for unfurnished one-bedroom rentals this month, with an unfurnished one-bedroom unit renting for $2,809/month, while Sunset-Victoria Fraserview is the cheapest at $1,860/month.
We’ve added more new neighbourhoods to our monthly reports that aren’t shown in the data below. To see data on these additional neighbourhoods, statistics for furnished rentals, and neighbourhood breakdowns for other cities in Metro Vancouver, be sure to download your copy of our full report here.
Most expensive cities in Canada
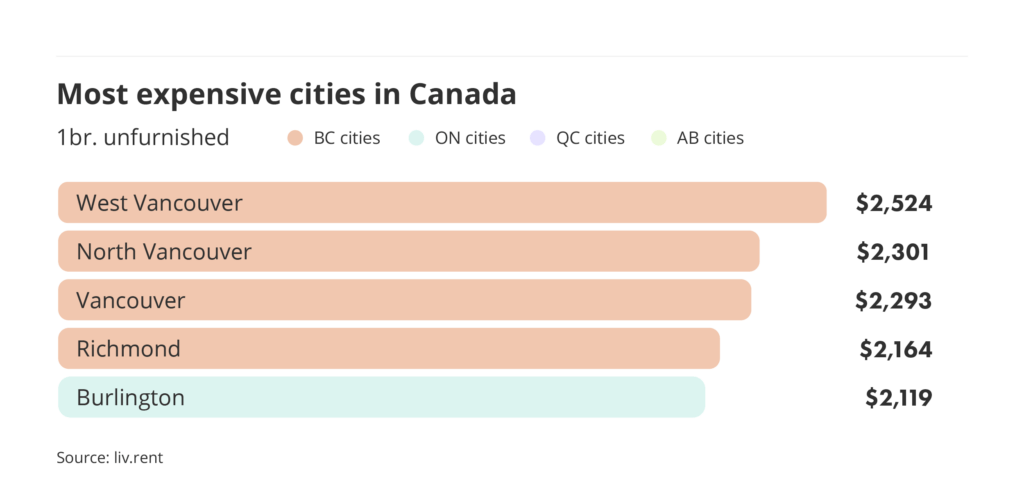
This July, the top 4 of the country’s most expensive cities are located in Metro Vancouver as West Vancouver claims the top spot as the most expensive city in the country to rent in, followed by North Vancouver, Vancouver, and Richmond with Burlington, Ontario rounding out the top 5.

Other rental data
These insights are exclusive to our blog and are intended to give more context to each month’s rental data. Based on data sourced directly from liv.rent, these statistics provide a more comprehensive overview of the current rental situation in Canada.
Renter demographics
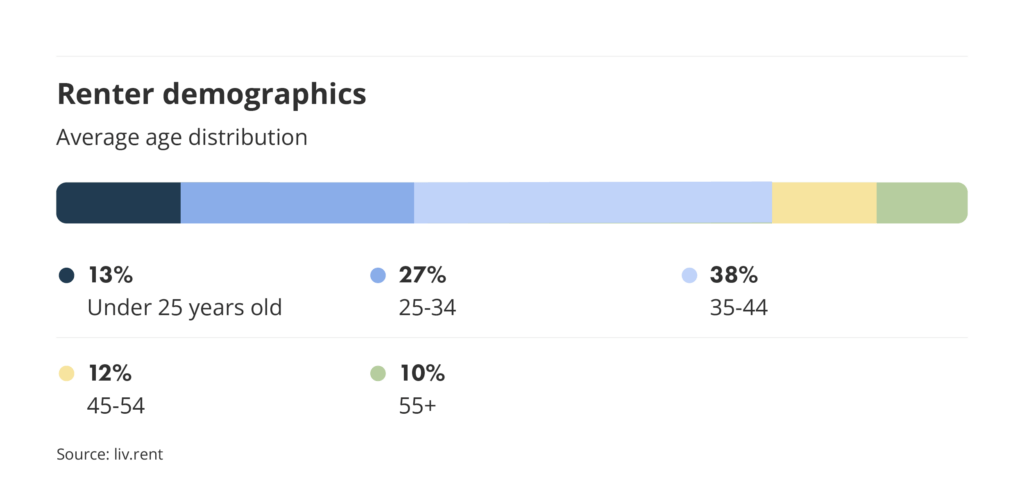
On liv.rent, renter demographics are spread across several age groups, with the largest share of renters aged 35-44 at 38%, followed by those aged 25-34 at 27%. Renters under 25 also make up a notable share of the platform’s audience at 13%.
Pet-friendly rentals
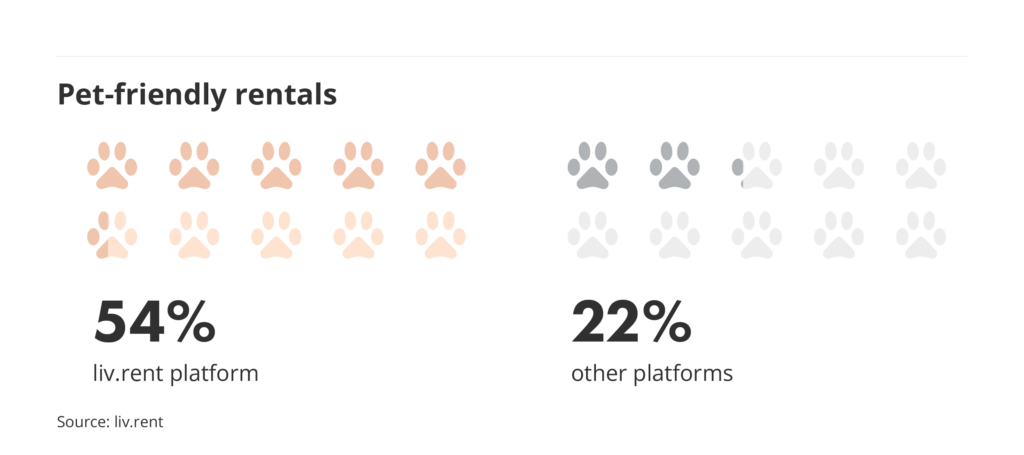
We’re proud to say that liv.rent continues to be the rental platform with the most pet-friendly rentals. This July, other rental platforms had just 22% of units available that were pet-friendly, while on liv.rent, 54% of all listed units were pet-friendly.
>> Recommended Reading: The Top 8 Pet Friendly Neighbourhoods in Metro Vancouver
Downloadable resources
Download The Latest Vancouver Rent Report
For the complete Vancouver rent report including new neighbourhood breakdowns, download here.
Rental resources for B.C. renters
You can read these comprehensive guides for more information on renting in B.C. and using liv.rent to streamline your rental process.
- BC Residential Tenancy Agreement Explained
- Guide to BC Tenancy Forms
- The Complete User Guide To liv.rent For Landlords & Property Managers
- The Ultimate Renter’s Guide To Using liv.rent
Data collection methodology
Our monthly rent reports use data from our own liv.rent listings, as well as data our team manually collects from other popular listing sites – looking at available basement suites, apartments, condos, townhouses, semi-detached houses, and single-detached houses for each area.
When collecting this data, we do exclude luxury properties listed at over $5,000, as well as rooms for rent and shared accommodation. Investing in manual data collection means that we only consider the current month’s listing, since we can filter out duplicate listings and older ads that haven’t been removed.
Another key difference between our data collection methods and some government agencies like the CMHC is that we only include current asking rent prices. Many official reports will include data for entire buildings in their reports, which tends to skew numbers lower since many units are already occupied, and may be rent-controlled or rented for significantly lower than the current rates.
As we are a Canadian rental platform founded and based in Vancouver, we want to ensure that we’re providing a completely accurate depiction of the rental market in the cities we look at.

Rethink The Way You Rent
Not on liv.rent yet? Experience the ease of digital applications & contracts, verified tenants & landlords, virtual tours and more – all on one platform. Sign up for free or download the app.
Subscribe to receive monthly updates on Canada’s major rental markets. Discover last month’s Rent Reports below:
Vancouver Rent Report
Ontario Rent Report
Montreal Rent Report
Calgary and Edmonton Rent Report

0 Comments