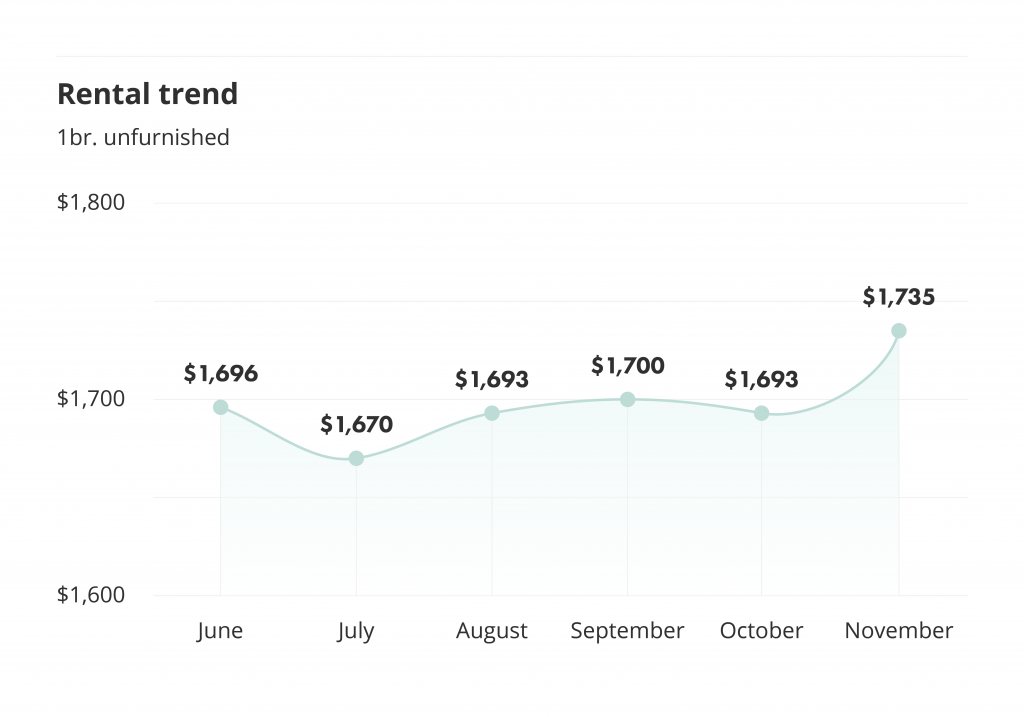
- The average rental price for one-bedroom unfurnished units in Toronto has risen to $1,735 in November.
- Furnished units are consistently cheaper than their unfurnished counterparts in Brampton this month.
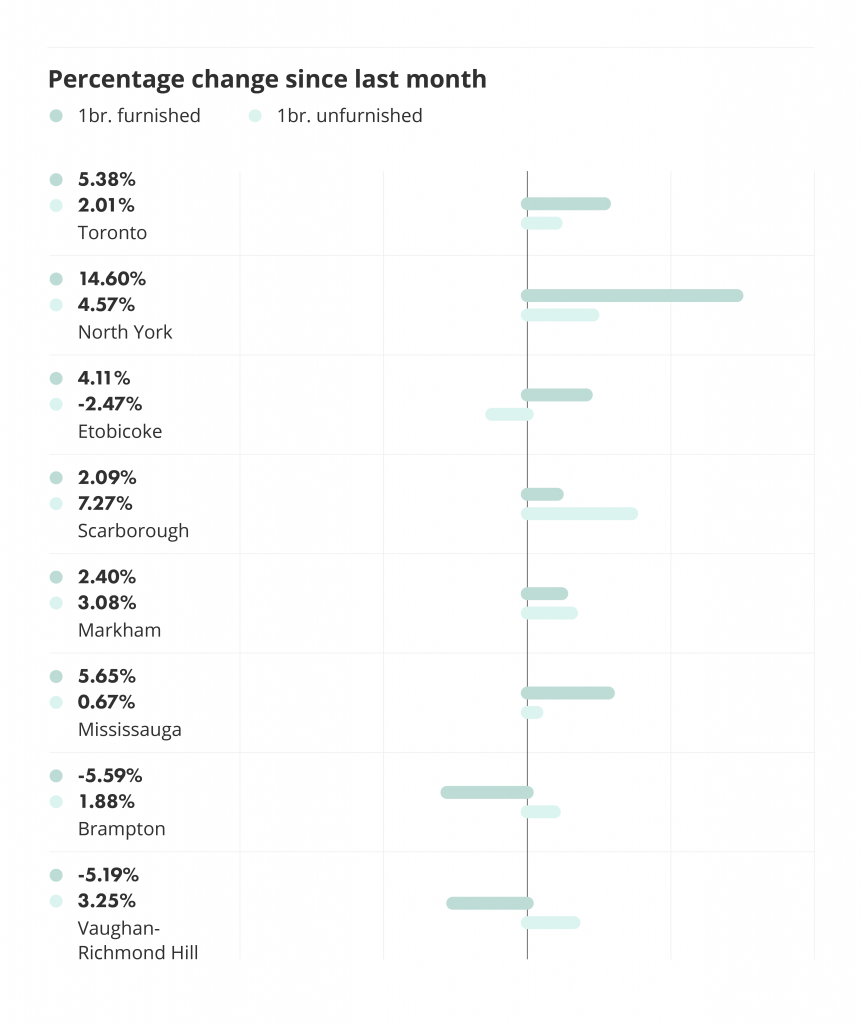
- North York continues to see large rent increases, particularly in furnished units which are up 14.60%.
For the first time this year, the average rental price for the Greater Toronto Area has risen solidly above $1,700. It remains to be seen whether this will be an anomaly or if Toronto is heading towards further price action through the remainder of 2021. Overall, there wasn’t much significant change in price by neighbourhood, aside from a few partial price corrections following last month’s whirlwind changes.
You can get the latest updates on the Toronto rental market straight to your inbox when you subscribe to keep on top of the trends.
Let’s take a look now at the latest data and see which neighbourhoods are experiencing the most change in furnished and unfurnished rental rates.
Jump to the following Toronto Rent Report sections:
Download The Latest Toronto Rent Report
For the complete Toronto rent report, download here.
Toronto rent trends
After months of relative stagnation, rent for one-bedroom unfurnished apartments in Toronto is seeing gains yet again. We’ll have to wait and see whether this is simply an unexpected exception to the stable prices of the past few months or the start of a larger trend.
liv.rent has officially landed in Toronto
Start your search today and browse through verified condos, houses and apartments for rent in Toronto. Connect instantly with verified landlords and apply to multiple listings with just a few clicks.
Month-to-month rent change
This chart breaks down the percentage change in rent across all central Toronto neighbourhoods from October 2021 to November 2021.
Unfurnished Toronto rent trends
Unfurnished rental prices have remained stable in November for the most part. Downtown Toronto (+2.01%) saw minor gains, while Scarborough (+7.27%) had the biggest price increases this month.
Furnished Toronto rent trends
Furnished rental prices have stabilized for the most part after last month’s price action. After falling significantly last month, Mississauga (+5.65%) is making a return to its previous price level, while Etobicoke (+4.11%) has continued its gradual rise. North York (+14.60%) saw the largest gains for furnished rental units this month.
Toronto furnished vs unfurnished averages
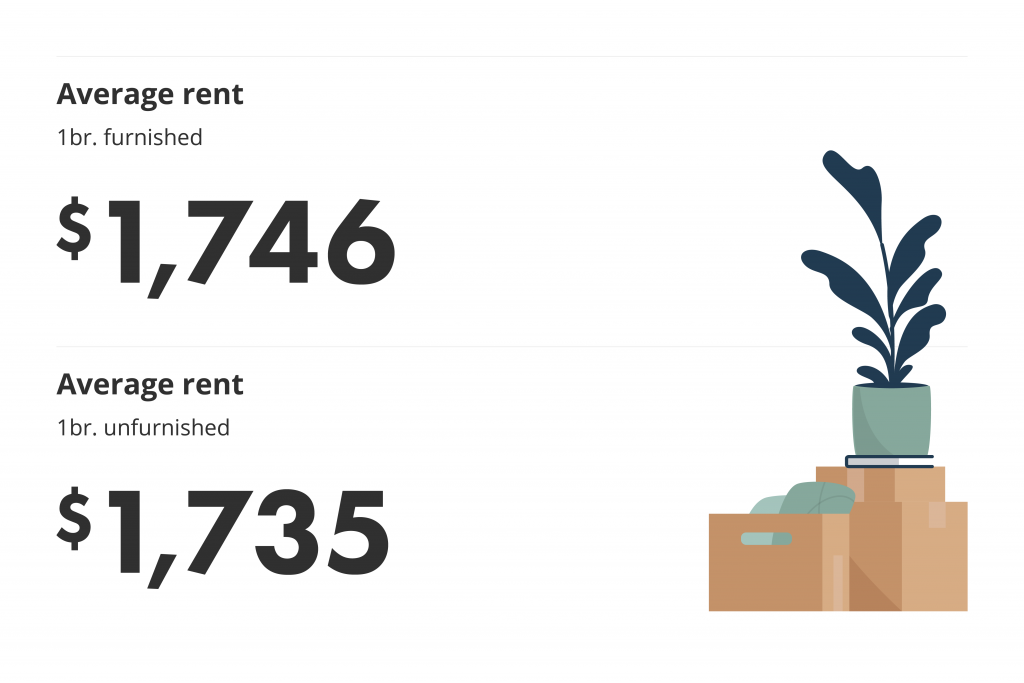
Continuing to monitor the close price difference in Toronto rent trends, right now in some neighbourhoods, furnished rentals continue to be cheaper than unfurnished ones on average — but just barely. November sees the two neck-in-neck, with furnished rentals only $11 cheaper on average than their unfurnished counterparts.
City breakdown
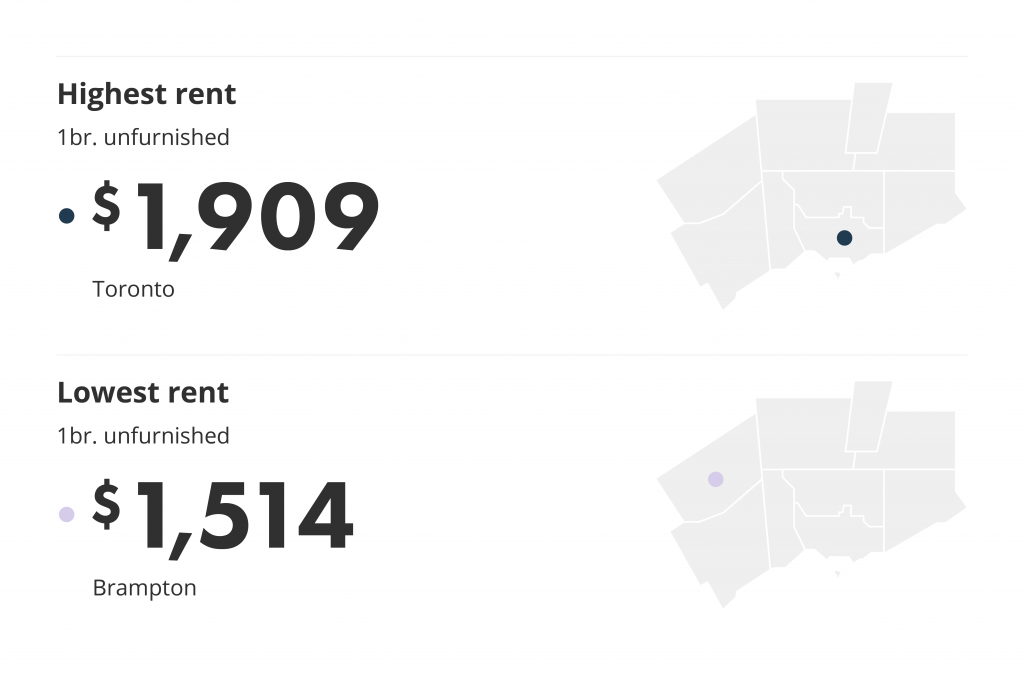
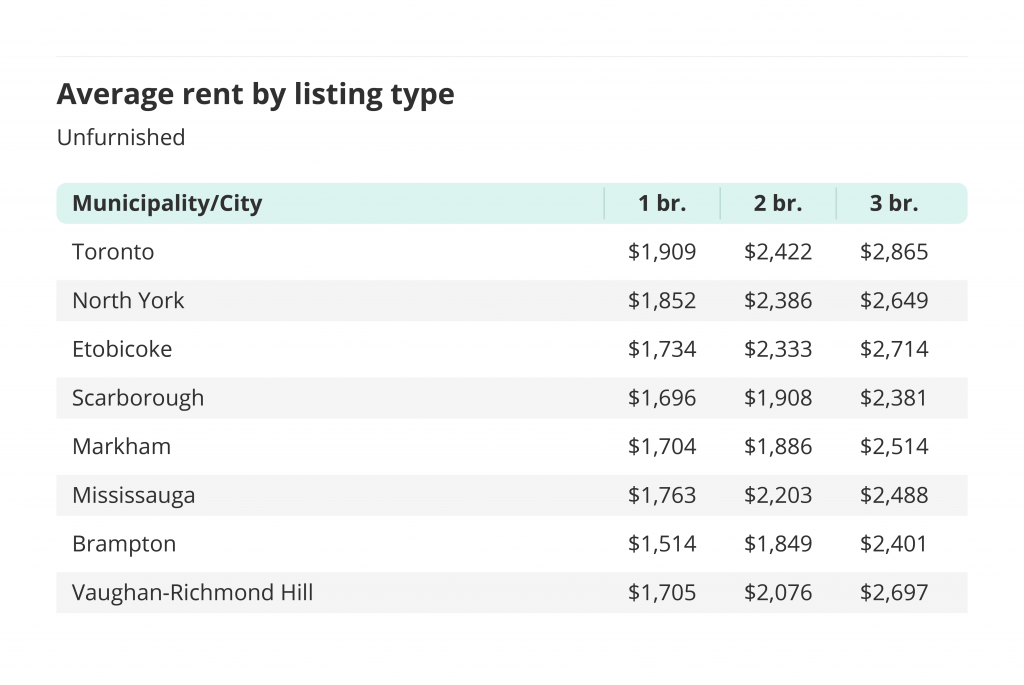
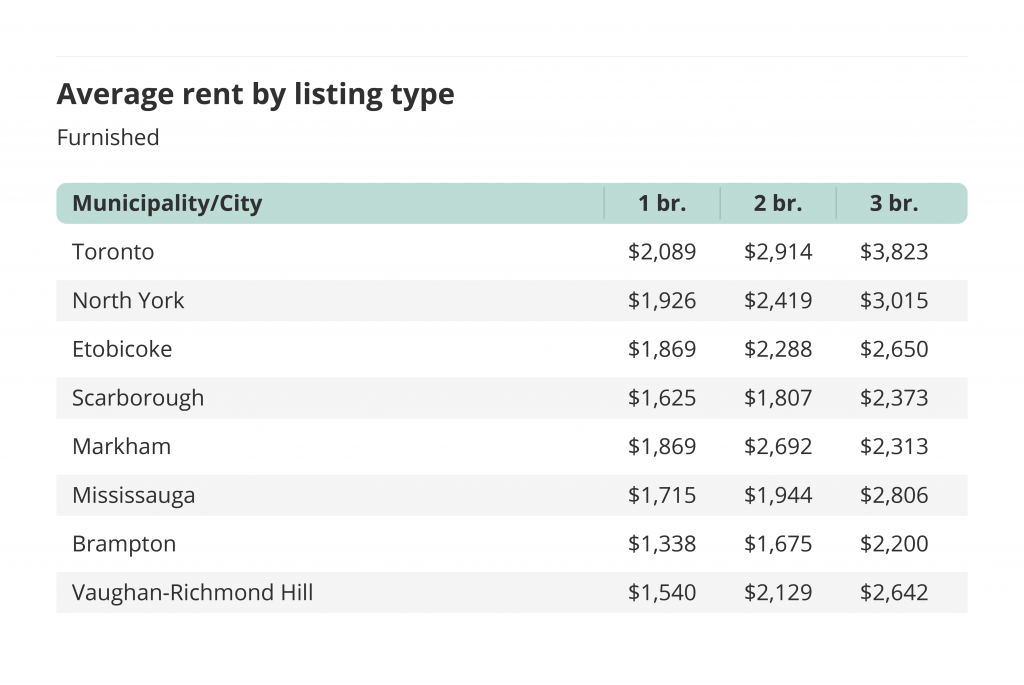
Brampton continues its reign as the most affordable GTA municipality while the most expensive remains Toronto itself.
While prices may have risen slightly across the board this month, Brampton remains the cheapest municipality for an unfurnished one-bedroom goes for $1,514 on average, but in Toronto, the same kind of unit averages $1,909 — a difference of $395.
Because Canada’s cities are so diverse, we’re breaking down the GTA into its different cities and municipalities to see the price difference within listing types: one-bedroom, two-bedroom, and three-bedroom units, both unfurnished and furnished.
- Etobicoke has overtaken North York as the second most expensive place for unfurnished three-bedroom units.
- A two-bedroom unfurnished unit is only $182 more expensive than a one-bedroom unit in Markham this month.
- Furnished one-bedroom units in Brampton are $176 cheaper than unfurnished units.
Rental averages outside of the GTA
New for November, we’ve explored data from neighbourhoods, cities, and municipalities outside of the Greater Toronto Region. For this new information, Kitchener had the most expensive rate for an unfurnished one-bedroom, at $1,438, while Niagara Falls had the cheapest, at $1,248.
Our complete November Rent Report has information on other key areas, broken down into region and unit type for a more complete overview of rental averages in Ontario. To view these and all the other new information we’ve added, be sure to download your copy of the Rent Report here.
Download The Latest Toronto Rent Report
For the complete Toronto rent report, download here.
Downloadable resources
Make a splash at your next video meeting and rep the latest rental averages and trends with our custom virtual backgrounds — always free to download.
Get your free virtual backgrounds
Were you looking for the full report? Download it for free here.
Download The Latest Toronto Rent Report
For the complete Toronto rent report, download here.
Renting in Ontario
For information on renting in Ontario, refer to these comprehensive resource posts:
- What’s A Standard Rental Application?
- What do you need when applying for a rental?
- What Can A Landlord Ask For On A Rental Application In Ontario?
- How Do I Fill Out A Rental Application?
- Ontario Standard Lease Explained
- Frequently Asked Questions: Everything You Need to Know About Eviction in Ontario

Rethink The Way You Rent
Not on liv.rent yet? Experience the ease of digital applications & contracts, verified tenants & landlords, virtual tours and more – all on one platform. Sign up for free or download the app.
Subscribe to receive these monthly updates on the Toronto rental market. Discover last month’s Rent Reports below:
October 2021 Vancouver Rent Report
October 2021 Toronto Rent Report
October 2021 Montreal Rent Report


0 Comments