

At a glance
- Biggest unit type decline
- Two-bedroom rents saw the steepest declines in Alberta, dropping -7.2% in Calgary and -6.6% in Edmonton year-over-year (May 2026 vs May 2025). This marked the largest decline across all unit types.
- Two-bedroom rents saw the steepest declines in Alberta, dropping -7.2% in Calgary and -6.6% in Edmonton year-over-year (May 2026 vs May 2025). This marked the largest decline across all unit types.
- Calgary Northeast leads Alberta rent declines
- Calgary Northeast recorded the biggest rent drop in Alberta, with one-bedroom rents falling -14.2% year-over-year ($1,546 → $1,326), while all other areas also declined between -2.4% and -10.8%.
- Calgary Northeast recorded the biggest rent drop in Alberta, with one-bedroom rents falling -14.2% year-over-year ($1,546 → $1,326), while all other areas also declined between -2.4% and -10.8%.
- Strongest growth contrast in 2026
- Edmonton Southeast led rent growth in 2026, with one-bedroom rents rising +4.3% since January, from $1,275 to $1,330, while most areas changed by less than 2%.
- Edmonton Southeast led rent growth in 2026, with one-bedroom rents rising +4.3% since January, from $1,275 to $1,330, while most areas changed by less than 2%.
Download The Latest Calgary and Edmonton Rent Reports
For the complete Calgary and Edmonton rent reports, download here.
Download liv.rent’s 2026 Canada Rental Market Trends Report for in-depth insights and forecasts on average rent prices, regional market comparisons, key economic drivers, and emerging AI trends shaping Canada’s rental landscape.
As of April 29th, 2026, the Bank of Canada maintains the interest rate at 2.25%, holding steady for the fourth consecutive announcement. Experts predict this rate will be maintained through most of 2026.
Let’s take a look now at the current rental costs and overarching trends in Calgary and Edmonton for May 2026. Don’t forget, you can download the entire report as a one-page infographic PDF below.
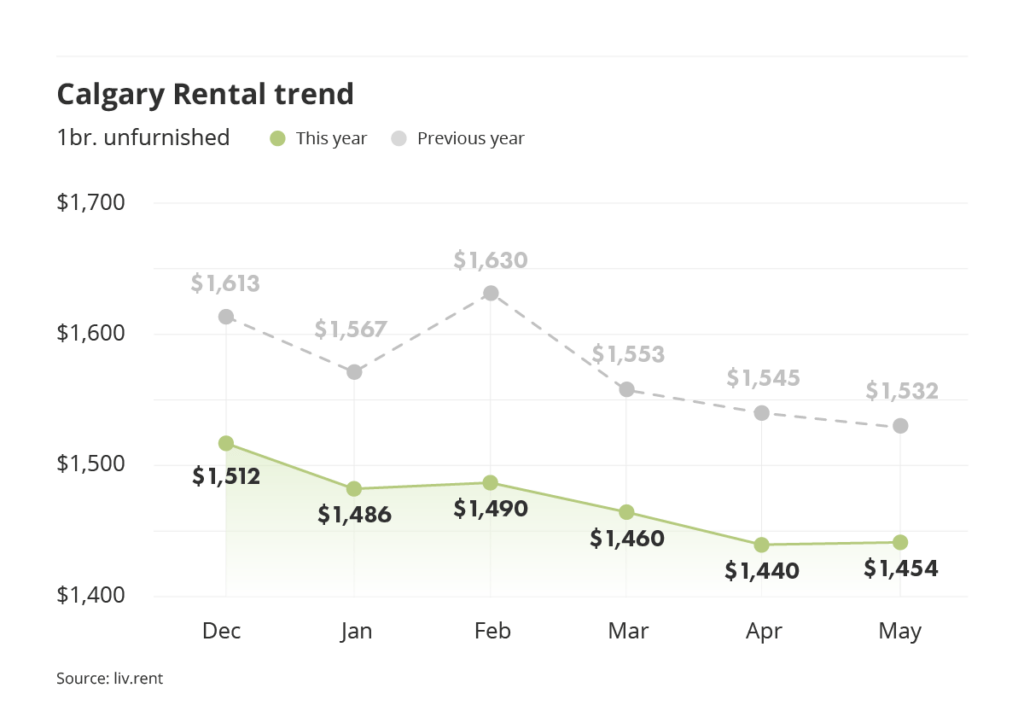
Average rent across Calgary
This May, Calgary’s city-wide average monthly rent price for an unfurnished one-bedroom unit increased by $14, bringing the rate for an unfurnished one-bedroom unit to $1,454/month.
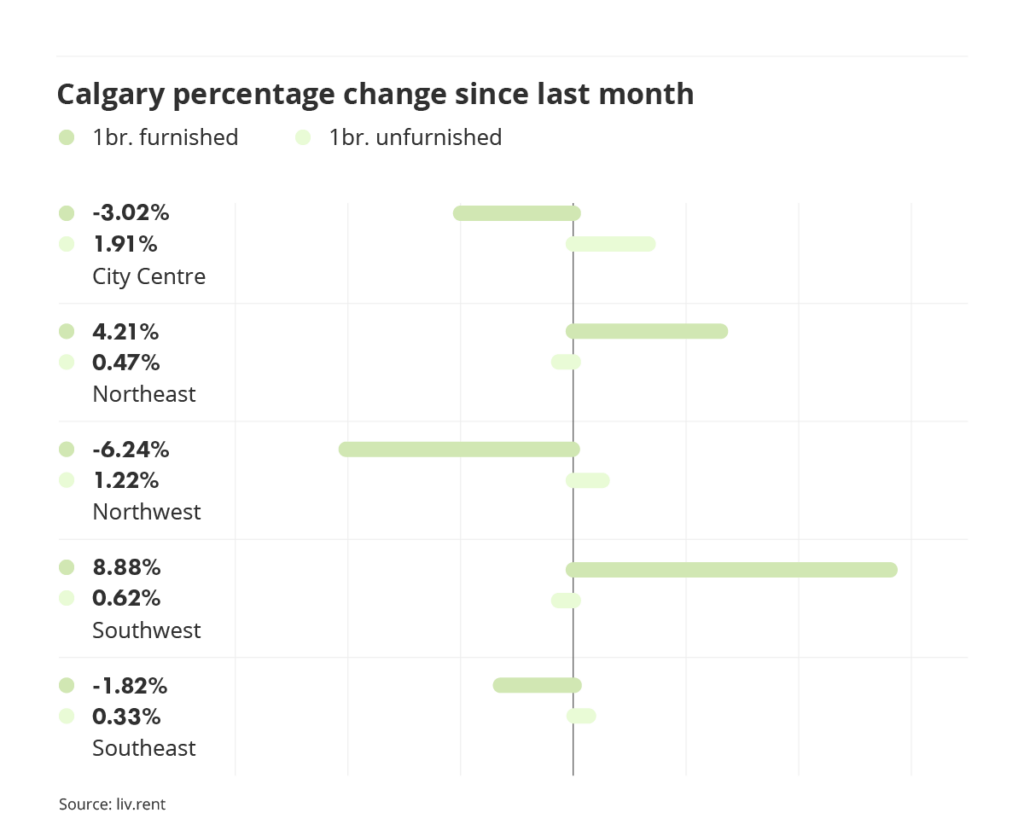
Month-to-month rent change
This chart breaks down the percentage change in rent prices across all of Calgary’s quadrants between April and May 2026.
For furnished one-bedroom units, largest decreases were seen in Northwest (-6.24%) and City Centre (-3.02%), while Southwest saw the largest increase (+8.88%). On the other hand, unfurnished one-bedroom units saw an increase across all quadrants, with City Centre (+1.91%) seeing the largest increase.
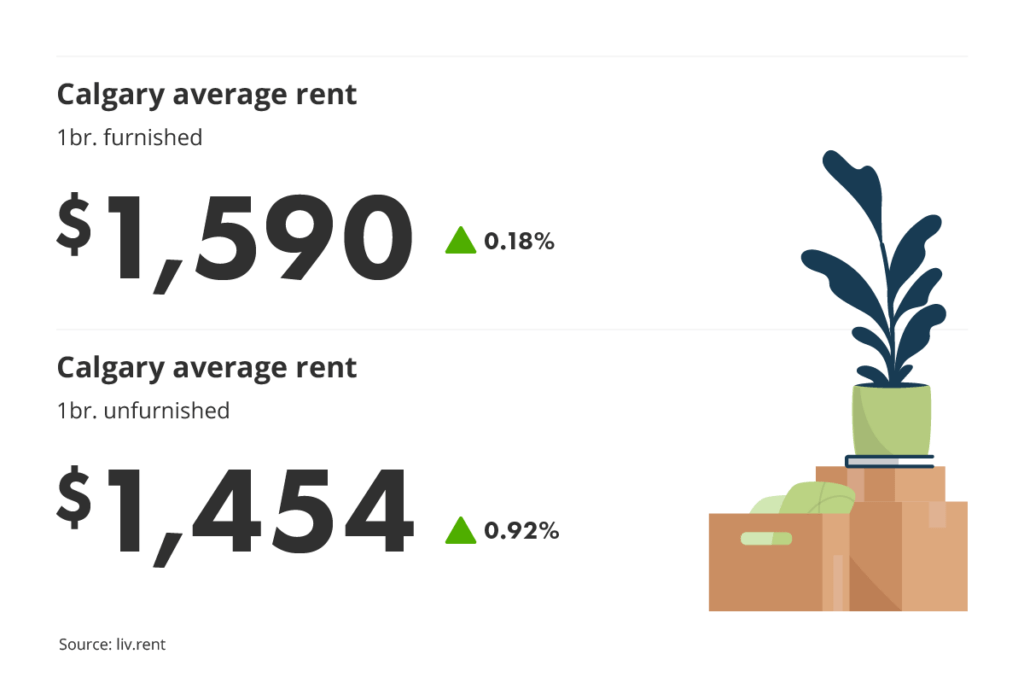
Average unfurnished vs furnished rates
Unfurnished vs furnished rates in Calgary
Average rates for furnished and unfurnished one-bedroom units in Calgary increased this month. The average monthly rent for an unfurnished one-bedroom unit increased (0.92%) to an average of $1,454/month this month. Prices for furnished one-bedroom units increased this month (0.18%), to a new average cost of $1,590/month.
At present, furnished units cost an average of $136 more per month to rent than unfurnished units. This means that landlords are likely to earn a higher profit by renting their units furnished.
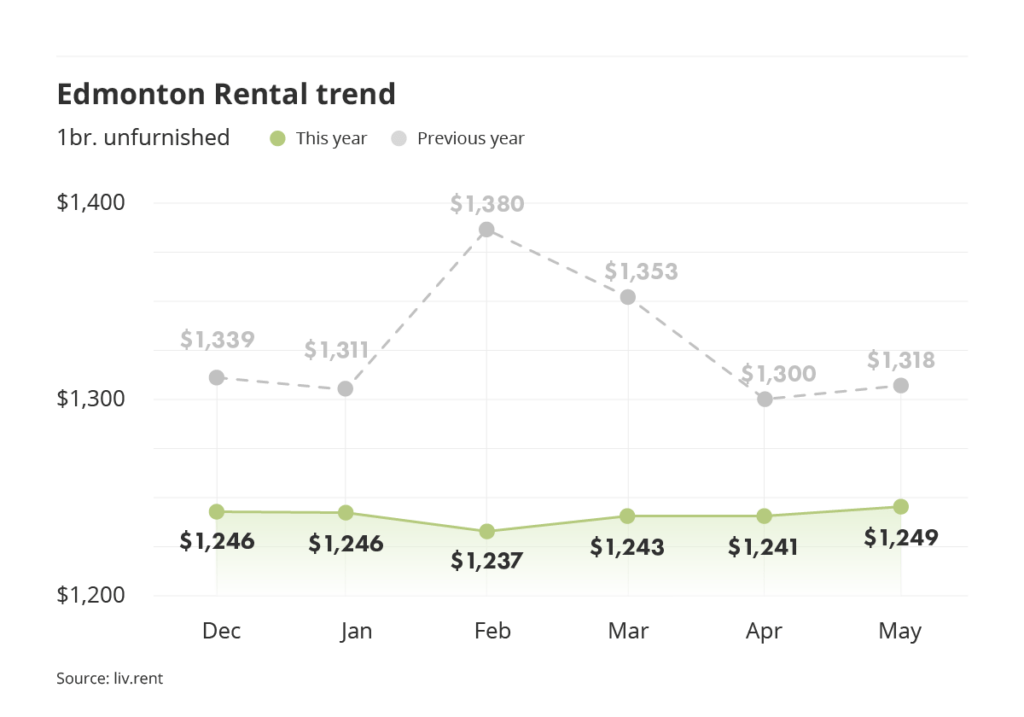
Average rent across Edmonton
This month, Edmonton’s rental rates for an unfurnished one-bedroom unit increased, making Edmonton’s average monthly rent $1,249/month. There is a significant difference from last year, when rent prices were $69 more than this May’s average rent.
Month-to-month rent change
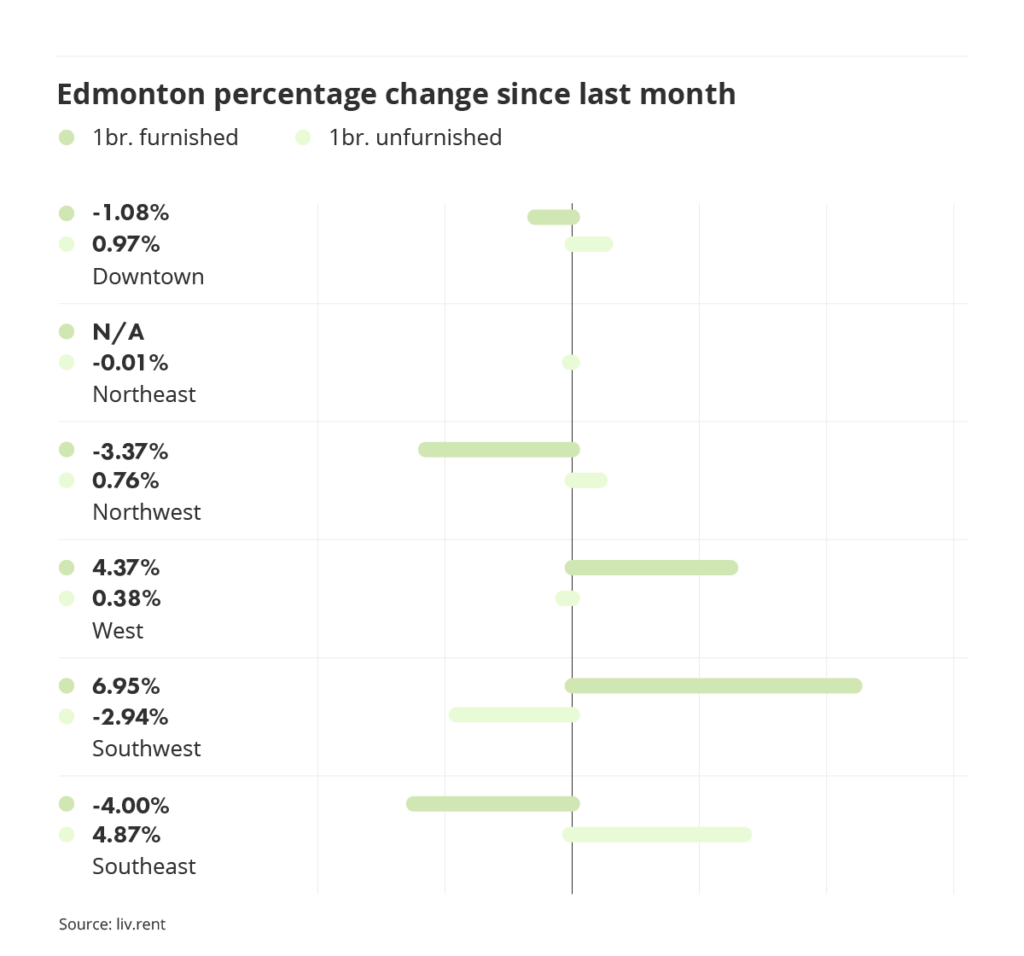
This chart breaks down the percentage change in rent prices across all of Edmonton’s different sectors between April and May 2026.
This May, there was a substantial increase for furnished one-bedroom units in Southwest Edmonton (6.95%), while there were notable decreases seen in Southeast Edmonton (-4.00%) and Northwest Edmonton (-3.37%). On the other hand, Southeast Edmonton saw the largest increase (+4.87%) for unfurnished one-bedroom units.
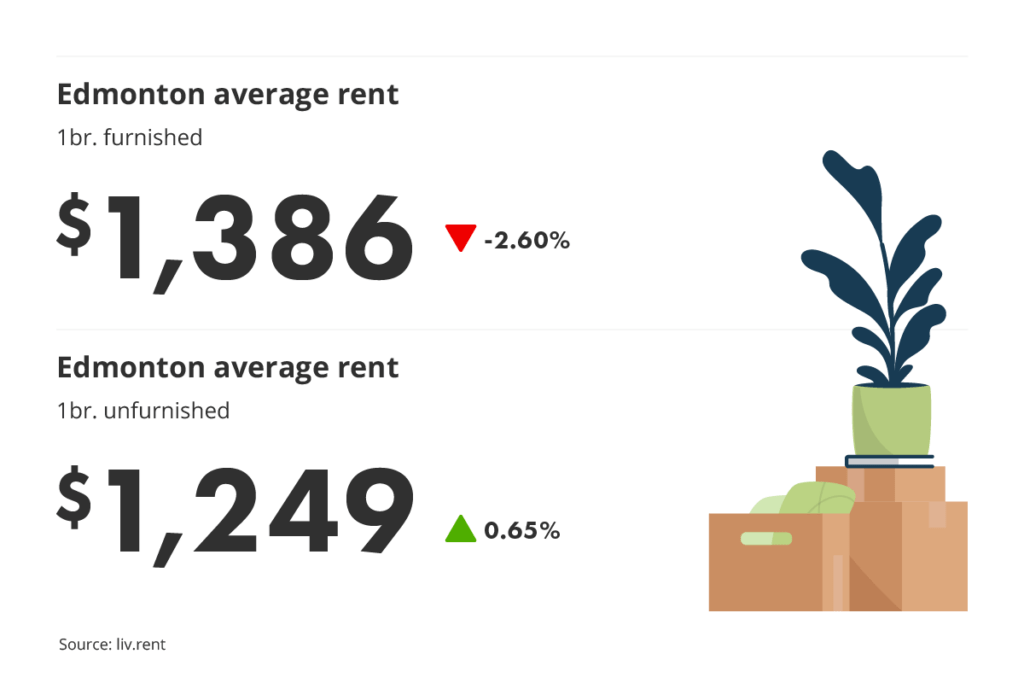
Unfurnished vs furnished rates in Edmonton
In Edmonton, average monthly rent prices for furnished one-bedroom units decreased (-2.60%) to $1,386/month, while prices for unfurnished one-bedroom units increased (0.65%) to $1,249/month. As of May 2026, furnished units in Edmonton rent for an average of $137 more than unfurnished units. This indicates that landlords who can rent their units furnished would benefit from doing so, particularly on a short-term basis.
Try Premium Landlord Features for free!
Alberta landlords, elevate your rental game with a FREE one-month trial of liv.rent’s Growth plan! Access $68 worth of premium features like Multi-Platform Advertising and Trust Score tenant screening reports with Equifax® credit information.
Looking for our full May 2026 Calgary & Edmonton Rent Report? Download your copy here to get all the latest insights, including a detailed breakdown by neighbourhood.
Quadrant/Sector breakdown
To better understand each of these cities’ average rental prices, let’s break down both Calgary and Edmonton into their constituent quadrants/sectors. We’ll examine prices and trends for one-, two-, and three-bedroom units in each city for a more in-depth analysis.
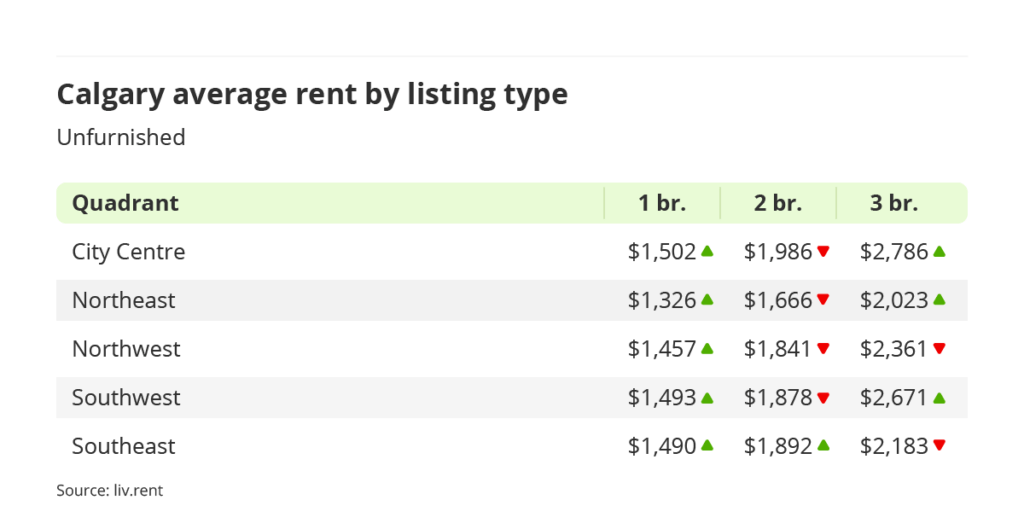
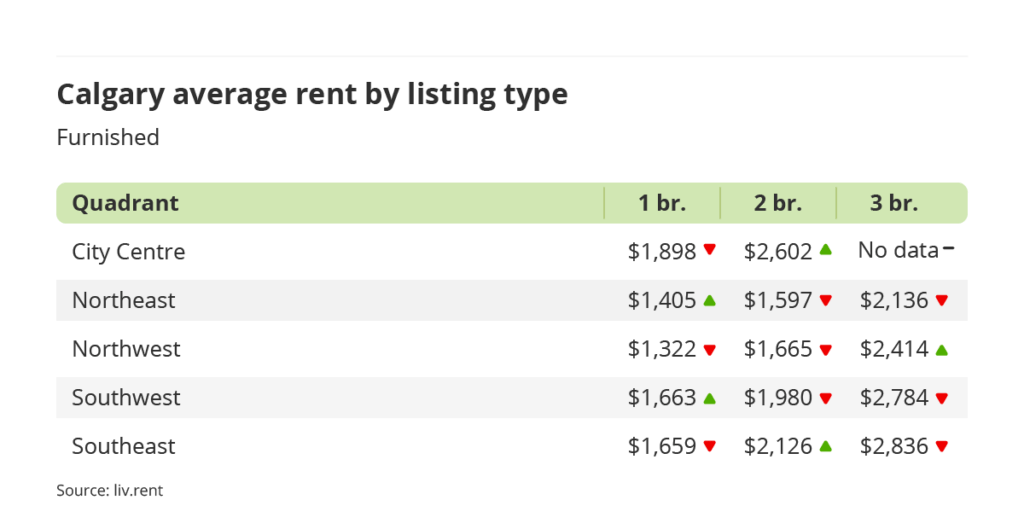
Quadrant breakdown: Calgary
- Prices increased for unfurnished one-bedroom units in all sectors.
- Prices decreased for all unfurnished two-bedroom units except in the Southeast.
- A little over half of unfurnished three-bedroom units increased in rental cost across Calgary quadrants except in the Northwest and Southeast.
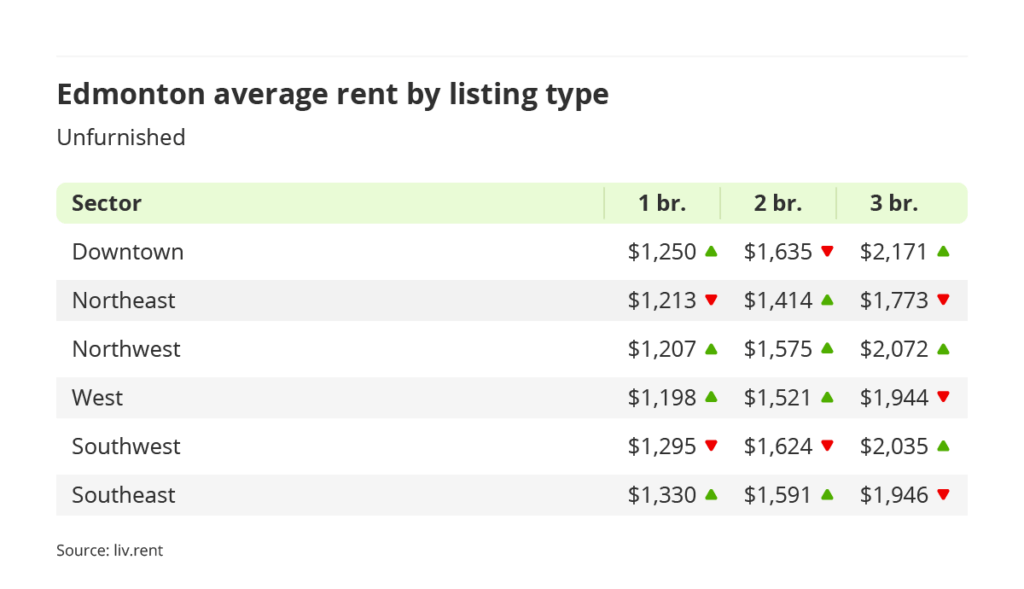
Sector breakdown: Edmonton
- Rents increased for unfurnished one-bedroom units in Downtown, Northwest, West, and Southeast Edmonton, while they decreased in Northeast and Southwest Edmonton.
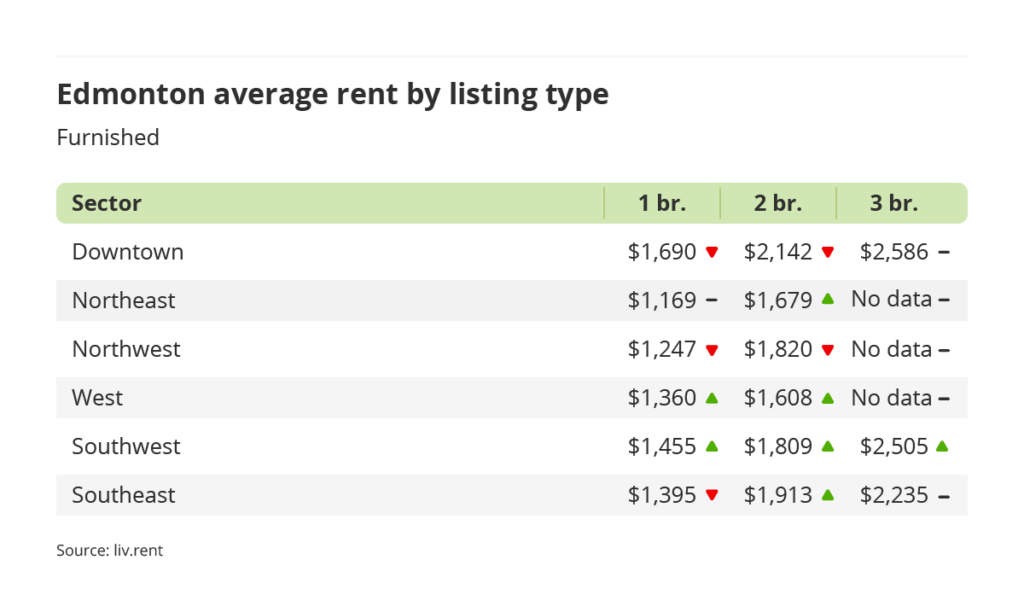
- Furnished rents increased for all unit types in Southwest Edmonton.
- Furnished two-bedroom rents saw an increase across all quadrants except Downtown and Northwest.
Downloadable resources
Download The Latest Calgary and Edmonton Rent Reports
For the complete Calgary and Edmonton rent reports, download here.
Rental resources for Alberta renters
You can read these comprehensive guides for more information on renting in Alberta and using liv.rent to streamline your rental process.
- FAQ: Landlord & tenant responsibilities in Alberta
- FAQ: Everything you need to know about rent deposits in Alberta
- The Complete User Guide To liv.rent For Landlords & Property Managers
- The Ultimate Renter’s Guide To Using liv.rent
Data collection methodology
Our monthly rent reports use data from our own liv.rent listings, as well as data our team manually collects from other popular listing sites – looking at available basement suites, apartments, condos, townhouses, semi-detached houses, and single-detached houses for each area.
When collecting this data, we do exclude luxury properties listed at over $5,000, as well as rooms for rent and shared accommodation. Investing in manual data collection means that we only consider the current month’s listing, since we can filter out duplicate listings and older ads that haven’t been removed.
Another key difference between our data collection methods and some government agencies like the CMHC is that we only include current asking rent prices. Many official reports will include data for entire buildings in their reports, which tends to skew numbers lower since many units are already occupied, and may be rent-controlled or rented for significantly lower than the current rates.
As we are a Canadian rental platform founded and based in Vancouver, we want to ensure that we’re providing a completely accurate depiction of the rental market in the cities we look at.
Rethink The Way You Rent
Not on liv.rent yet? Experience the ease of digital applications & contracts, verified tenants & landlords, virtual tours and more – all on one platform. Sign up for free or download the app.
Subscribe to receive monthly updates on Canada’s major rental markets. Discover last month’s Rent Reports below:
Vancouver Rent Report
Ontario Rent Report
Montreal Rent Report
Calgary and Edmonton Rent Report


0 Comments