


August 2026 Winnipeg rent report
At a glance
- Winnipeg’s citywide rent decline breaks a three-month climb
- The average asking rent for an unfurnished one-bedroom in Winnipeg fell to $1,338 in August, a decrease of 1.16% from July and the first month-over-month decline since April. Rents had climbed for three consecutive months, from $1,304 in April to $1,353 in July, before easing this month. Five of Winnipeg’s six neighbourhoods recorded lower unfurnished one-bedroom rents in August, with only St. Boniface posting an increase.
- Winnipeg Downtown posts declines across every unfurnished unit size
- Winnipeg Downtown was the only neighbourhood where unfurnished rents fell across all three unit sizes this month. Its unfurnished three-bedroom rent dropped 5.99% to $1,981, and its two-bedroom rent fell 5.52% to $1,836, while the one-bedroom average eased 1.63% to $1,334.
- Furnished units are not always the pricier option in Winnipeg
- In North End and South Winnipeg, average furnished one-bedroom asking rents came in below their unfurnished counterparts this month. North End’s furnished one-bedroom average was $906, compared with $1,316 unfurnished, while South Winnipeg’s furnished one-bedroom average was $863, compared with $1,369 unfurnished. Winnipeg Downtown followed the more typical pattern, with furnished one-bedroom units asking $1,606, about 20% more than the $1,334 unfurnished average.
Download the latest Winnipeg rent report
For the complete Winnipeg rent report including neighbourhood breakdowns, download here.
Download liv.rent’s 2026 Canada rental market trends report for in-depth insights and forecasts on average rent prices, regional market comparisons, key economic drivers, and emerging AI trends shaping Canada’s rental landscape.
Let’s look now at the current rental costs and overarching trends in Winnipeg for August 2026. Curious how Winnipeg compares with other major Canadian markets? Take a look at our latest Metro Vancouver and Toronto rent reports.
Average rent across Winnipeg
This month, the average asking rent for an unfurnished one-bedroom unit in Winnipeg decreased 1.16% from July, a drop of $15, settling at $1,338 per month. That marks the first month-over-month decline since April, breaking a run of increases that carried the citywide average from $1,304 in April to $1,353 in July. Even after this month’s pullback, Winnipeg’s average one-bedroom rent remains above where it started the spring.
Manitoba’s annual rent increase guideline for 2026 is set at 1.8%, calculated from the province’s Consumer Price Index and applying to most residential rental units. Landlords planning an increase should confirm their unit isn’t exempt, since units renting at $1,670 or more per month and buildings first occupied after March 2005 fall outside the guideline, and should provide tenants at least three months’ written notice before the increase takes effect.
Is your rental priced competitively?
Find out with a free rent estimate. Our team of rental experts will calculate your unit’s true value based on your listing details and current market trends.
Month-to-month rent change
Among unfurnished one-bedroom units, South Winnipeg recorded the largest decrease at 2.45%, followed by North End at 1.72% and Winnipeg Downtown at 1.63%. St. Boniface was the only neighbourhood to see an increase, up 1.37% from July.
Two-bedroom units softened across every neighbourhood this month, led by a 6.23% decline in North End. Three-bedroom units were more mixed: St. Boniface posted the largest increase at 7.60%, while Winnipeg Downtown recorded the largest decrease at 5.99%.
Winnipeg unfurnished vs. furnished rent averages
The citywide average asking rent for an unfurnished one-bedroom in Winnipeg decreased 1.16% this month to $1,338. Citywide furnished one-bedroom data was not available in August, but neighbourhood-level furnished figures tell an interesting story where they do exist.
Furnished units don’t always carry the premium renters might expect. In Winnipeg Downtown, a furnished one-bedroom asks $1,606 this month, about 20% more than the $1,334 unfurnished average there, in line with the usual pattern. But in North End and South Winnipeg, furnished one-bedrooms are actually asking less than unfurnished units in the same area: $906 versus $1,316 in North End, and $863 versus $1,369 in South Winnipeg. Renters open to a furnished unit in either neighbourhood may find it’s the better deal this month.

Is your rental priced competitively?
Find out with a free rent estimate. Our team of rental experts will calculate your unit’s true value based on your listing details and current market trends.
Looking for our full August 2026 Winnipeg rent report? Download your copy in the downloadable resources section for all the latest insights, including a detailed breakdown by neighbourhood.
Neighbourhood breakdown
Across Winnipeg’s six neighbourhoods, South Winnipeg is the most expensive place to rent this month, with an unfurnished one-bedroom asking $1,369 per month. St. Boniface is the most affordable at $1,301 per month, a gap of $68 between the city’s priciest and most affordable areas for a one-bedroom.

Let’s look even closer at the different listing types to see the differences in one-, two-, and three-bedroom rental rates across each area.
- All unfurnished one-bedroom rent prices decreased across Winnipeg neighbourhoods except St. Boniface.
- Unfurnished two-bedroom rent prices decreased across every Winnipeg neighbourhood this month.
- All types of unfurnished rental units decreased in Winnipeg Downtown.
For a full breakdown by neighbourhood and bedroom count, see the furnished and unfurnished tables below.


The table below is interactive: sort any column, or download it as an image.
Here is the month-over-month percentage change in unfurnished rent by neighbourhood.
Is your rental priced competitively?
Find out with a free rent estimate. Our team of rental experts will calculate your unit’s true value based on your listing details and current market trends.
Be sure to subscribe to our mailing list so you never miss an update on the Winnipeg rental market.
Downloadable resources
Download the latest Winnipeg rent report
For the complete Winnipeg rent report including neighbourhood breakdowns, download here.
Data collection methodology
Our monthly rent reports use data from our own liv.rent listings, as well as data our team manually collects from other popular listing sites, covering available basement suites, apartments, condos, townhouses, semi-detached houses, and single-detached houses for each area.
When collecting this data, we exclude luxury properties listed at over $5,000, as well as rooms for rent and shared accommodation. Investing in manual data collection means we consider only the current month’s listings, since we can filter out duplicate listings and older ads that have not been removed.
Another key difference between our data collection methods and those of agencies such as the Canada Mortgage and Housing Corporation is that we include only current asking rent prices. Many official reports include data for entire buildings, which tends to skew numbers lower since many units are already occupied and may be rent-controlled or rented well below current rates.
As a Canadian rental platform, we want to provide a completely accurate depiction of the rental market in the cities we cover.
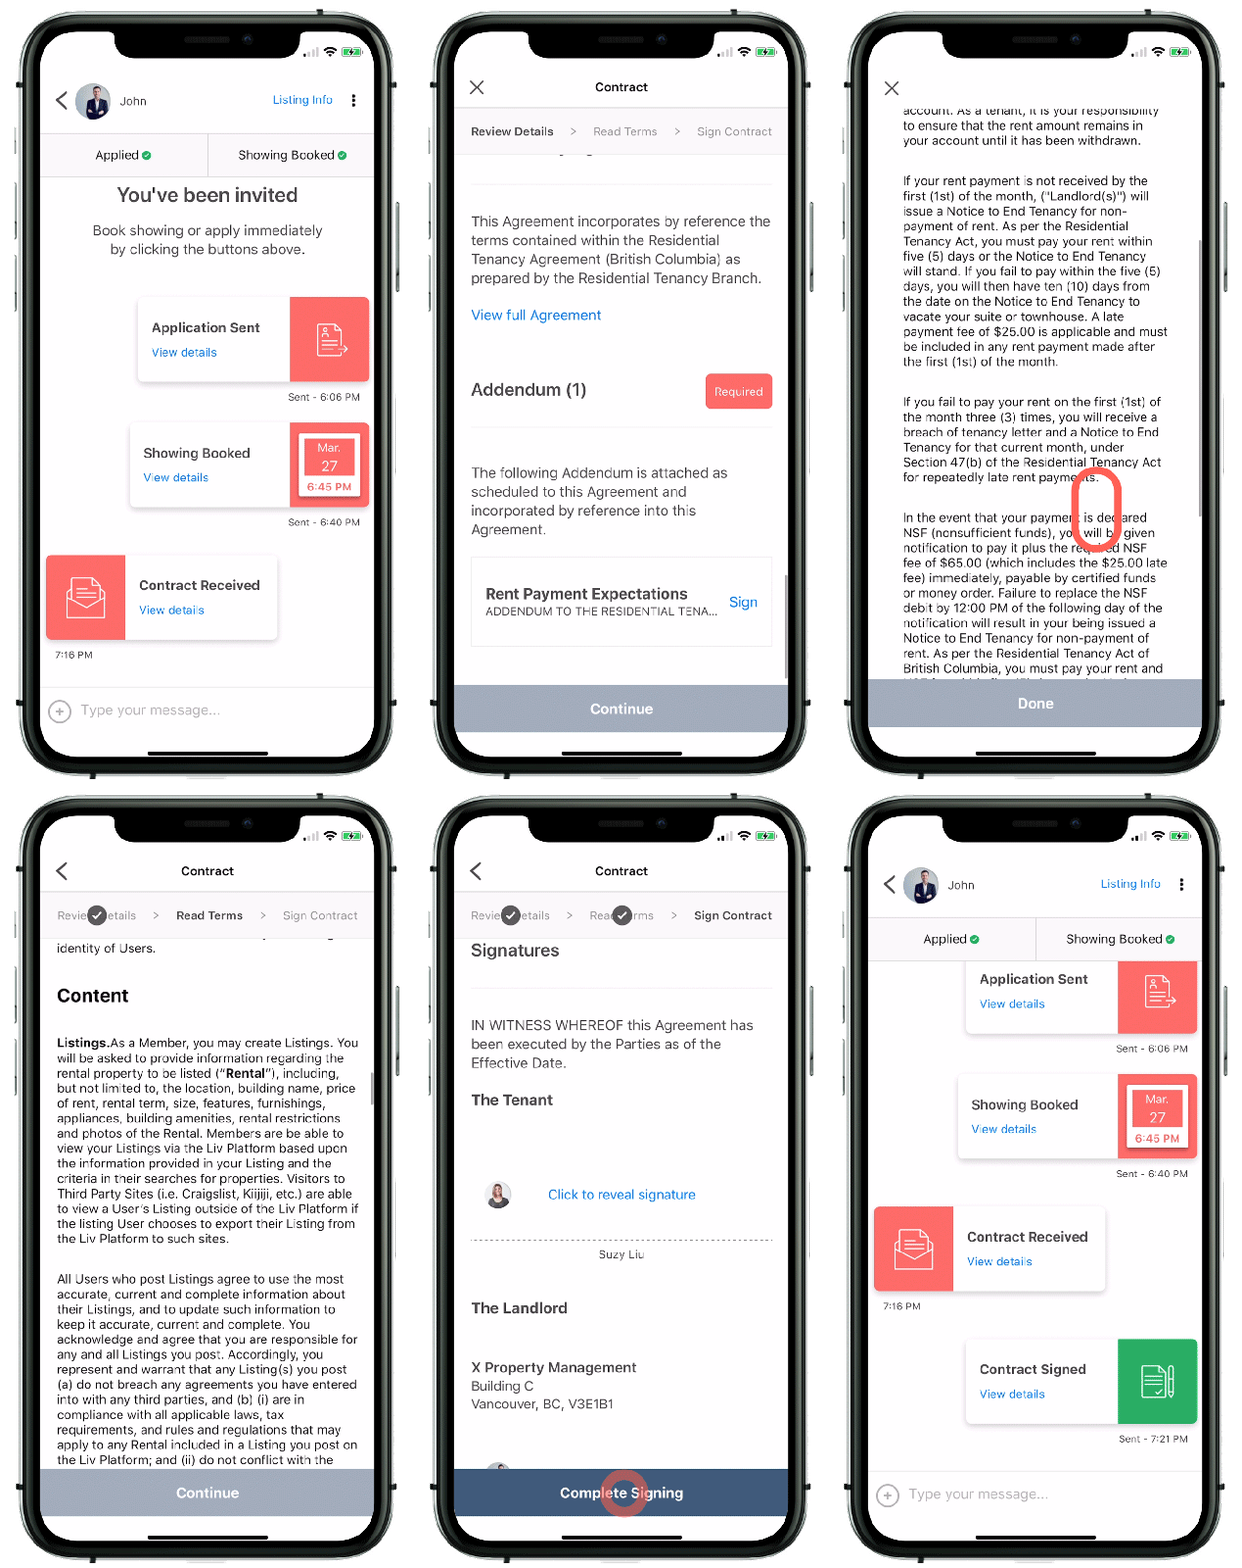
Rethink the way you rent
Not on liv.rent yet? Experience the ease of digital applications and contracts, verified tenants and landlords, virtual tours, and more, all on one platform. Sign up for free or download the app.
Subscribe to receive monthly updates on Canada’s major rental markets. Discover last month’s rent reports below:
Vancouver rent report
Ontario rent report
Montreal rent report
Calgary and Edmonton rent report

0 Comments