

At a glance
- Double dip: Both furnished and unfurnished rents slide this April
- Rental prices for both furnished and unfurnished one-bedroom units fell this month. Furnished units led the decline with a (-1.05%) drop, while unfurnished units dropped (-0.33%). North York saw the steepest drop at (-9.61%) for one-bedroom furnished units. This pushed furnished units to now rent for $51 less on average than unfurnished units, a rare flip in typical pricing trends.
- Toronto rents keep sliding, now down $127/month YoY
- The average one-bedroom unfurnished unit in Toronto is now renting for $127/month less than it was in April 2024. Month-over-month, rents also declined by $7, continuing the city’s cooling rental trend.
- GTA shake-up: Unfurnished rents fall across 4 GTA areas while rising in 2
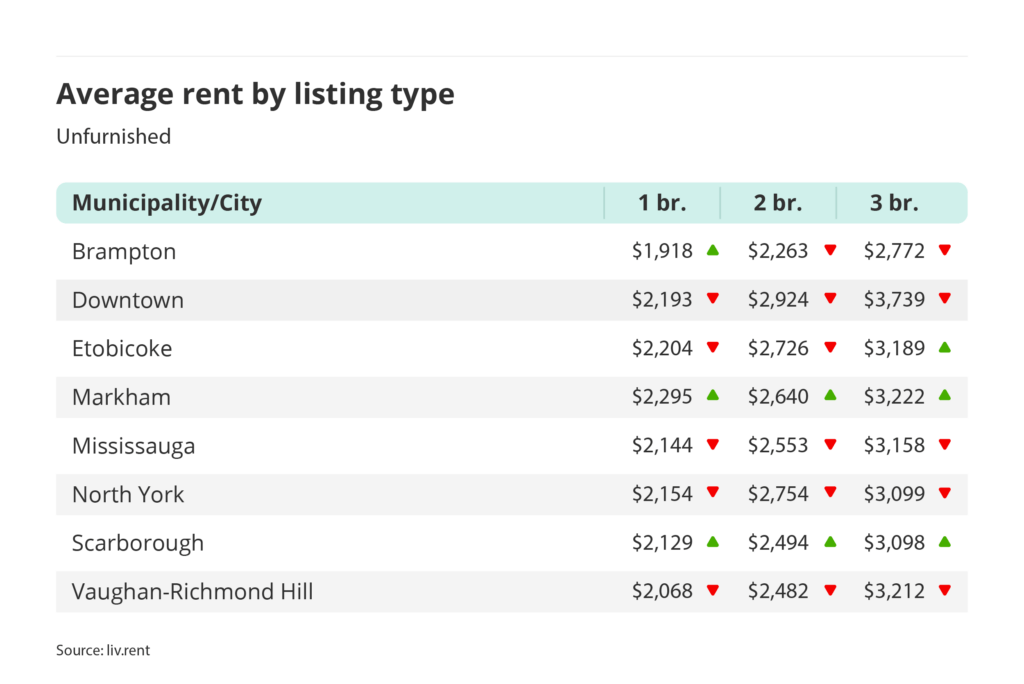
- While Downtown Toronto, Mississauga, North York, and Vaughan–Richmond Hill all posted declines in unfurnished rents for all unit types this April, other GTA cities like Markham and Scarborough moved in the opposite direction, recording increases for all types of unfurnished units.
Download The Latest Toronto Rent Report
For the complete Toronto rent report, download here.
liv.rent’s 2025 Canada Rental Market Trend Report is now live! Explore the latest rental trends across Canada, uncover key factors driving price changes, and gain exclusive insights into how landlords and renters perceive the market nationwide. Download your copy here.
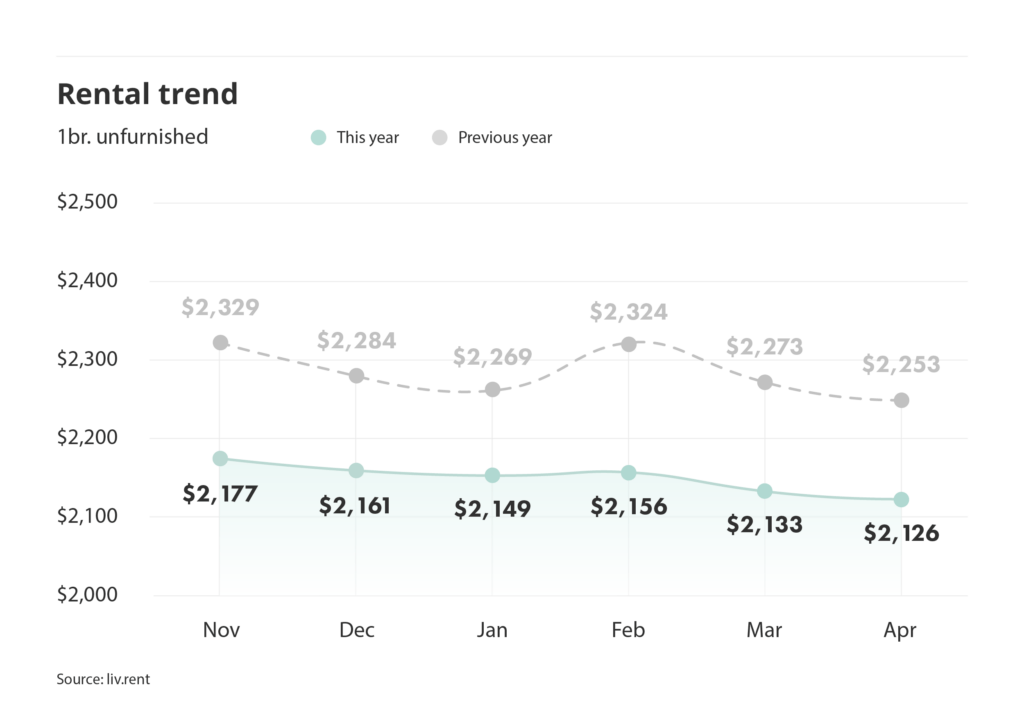
As of April 2025, the City of Toronto’s average monthly rent price for an unfurnished one-bedroom saw a YoY drop of $127 to a new monthly average of $2,126 this month.
Let’s take a look now at the latest data and see which neighbourhoods are experiencing the biggest changes in furnished and unfurnished rental rates.
Toronto rent trends
Compared to last month, the average rent price for an unfurnished one-bedroom unit in Toronto decreased by $7 this April. Looking at a year-over-year comparison, the average monthly rent for an unfurnished one-bedroom unit in Toronto has decreased, dropping by $127 since April 2024.
Planning on raising rent this year? Ontario’s Annual allowable rent increase limit for 2025/2026 is 2.5%. Find out when and how you can increase rent and ensure you’re complying with provincial guidelines by reading our updated Guide to Ontario Rent Increases.
>> Recommended Reading: What is Ontario’s maximum allowable rent increase?
Is your rental priced competitively?
Find out with a free rent estimate. Our team of rental experts will calculate your unit’s true value based on your listing details & current market trends.
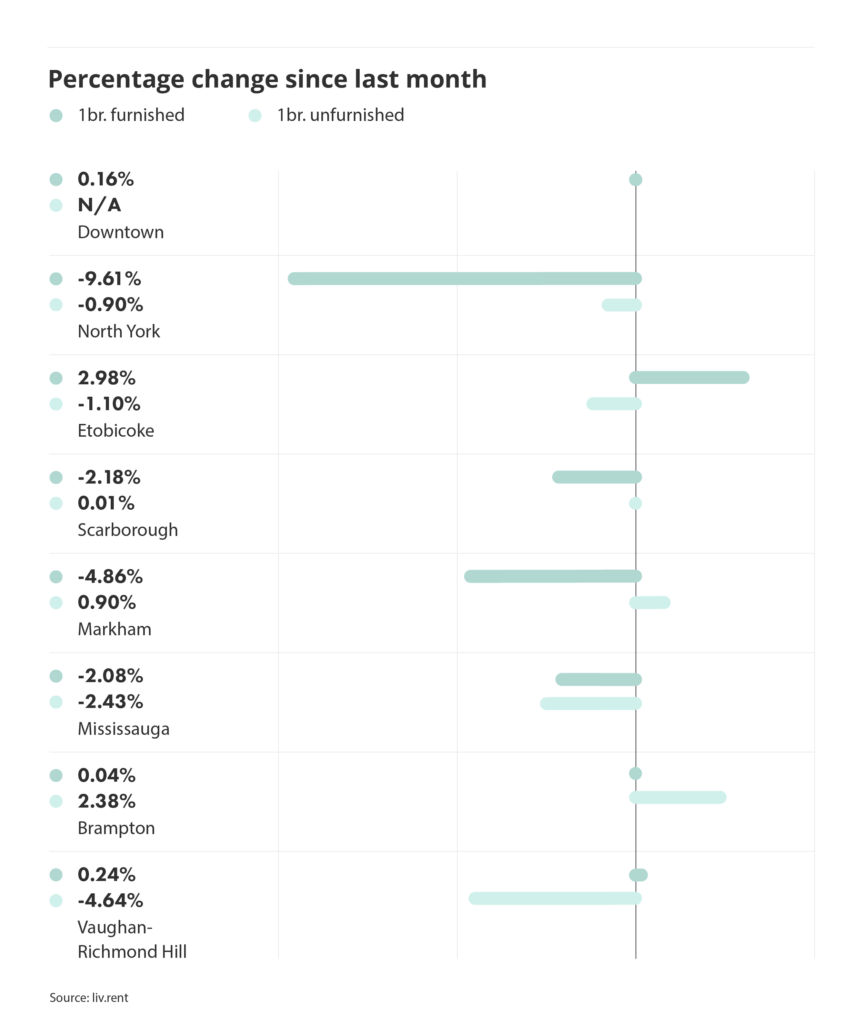
Month-to-month rent change
This chart breaks down the percentage change in rent prices across all GTA cities/municipalities between March and April 2025.
Unfurnished Toronto rent trends
Rates for unfurnished one-bedroom units in the GTA varied depending on the neighbourhood. When looking at one-bedroom units, Vaughan-Richmond Hill saw the largest decrease at (-4.64%), while Brampton saw the largest increase at (+2.38%).
Furnished Toronto rent trends
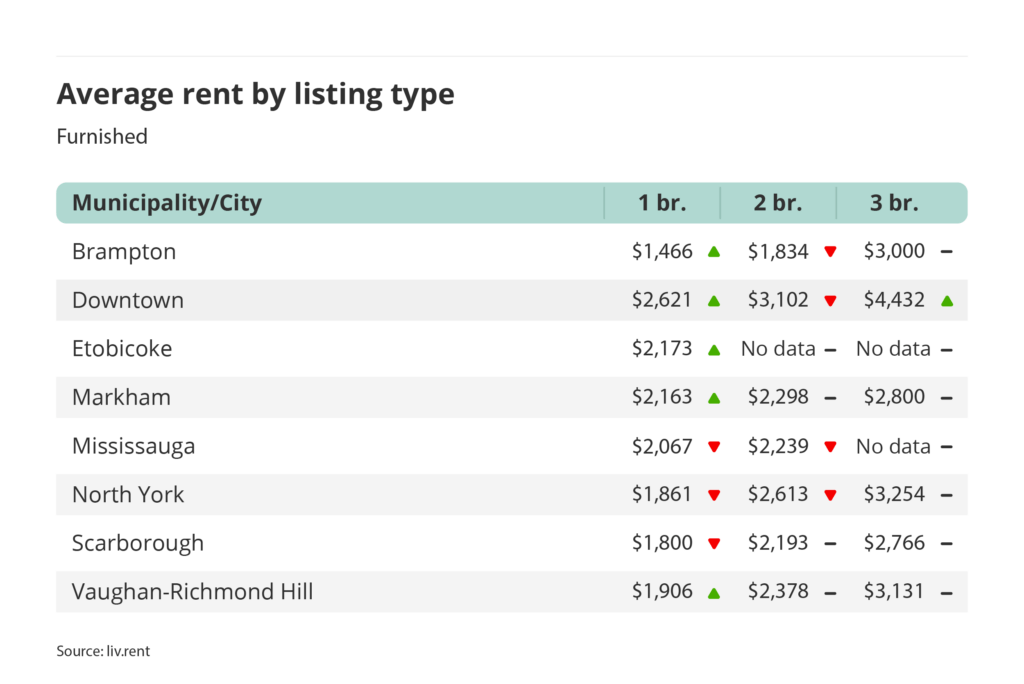
This month, average rates for furnished one-bedroom units in the GTA saw two major changes. North York saw the largest decrease at (-9.61%), while Etobicoke saw the largest increase at (+2.98%).
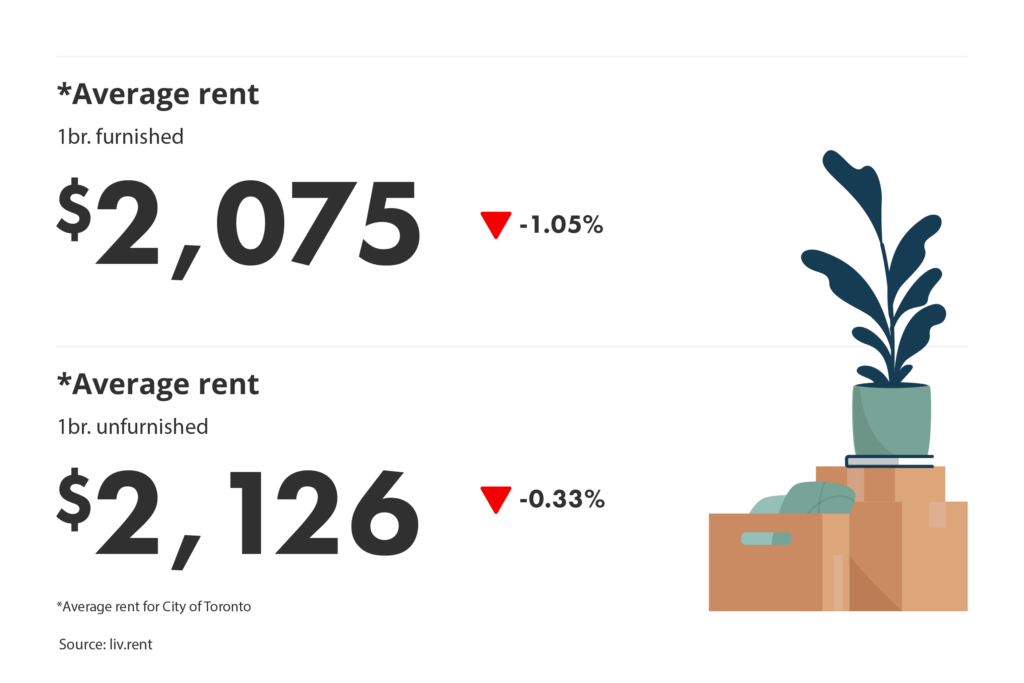
Toronto furnished vs unfurnished averages
This April, prices for unfurnished one-bedroom units saw a (-0.33%) decrease while furnished units saw a (-1.05%) decrease. The average one-bedroom unfurnished unit rents for $51 more than a one-bedroom furnished unit. This means that at present, landlords won’t see profits renting out their units furnished – although they may still be able to capitalize on the demand for short-term rentals.
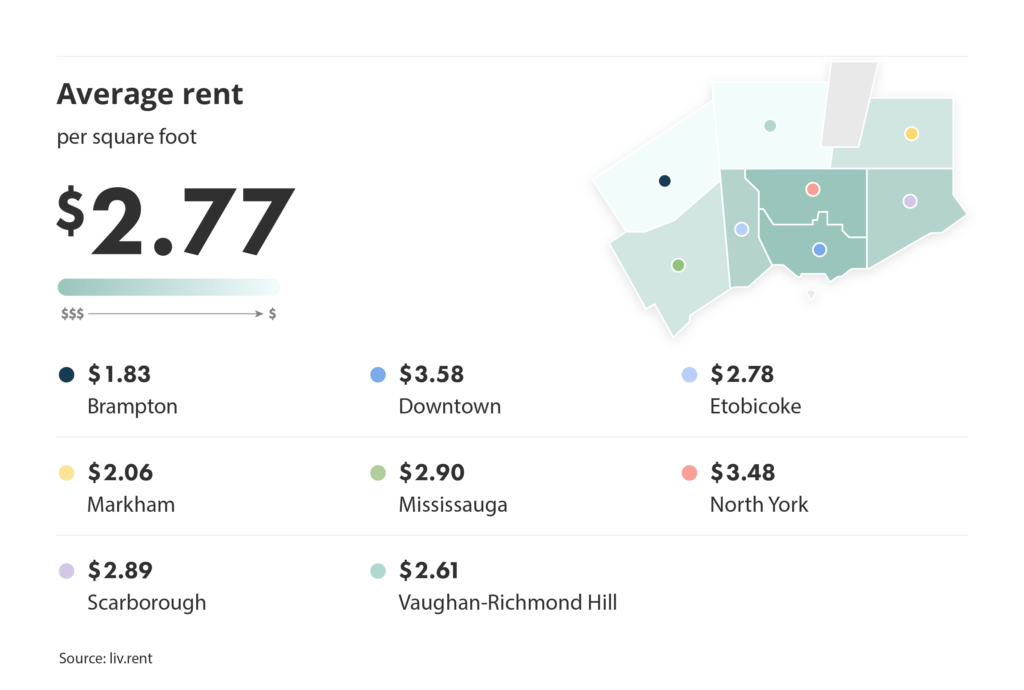
Rent per square foot
Our monthly Rent Reports also look more closely at the average rent per square foot in cities throughout the Greater Toronto Area. This April, Downtown ($3.58/sq. ft.) and North York ($3.48/sq. ft.) have the most expensive average rent per square foot, followed by Mississauga ($2.90/sq. ft.).
Active listing data
We’ll also look at detailed statistics for currently active listings available to see which property types and number of bedrooms are the most represented. For renters, these numbers show which types of units you’re most likely to encounter in the Greater Toronto Area, while for landlords, you can assess how much competition you’ll face based on the current supply.
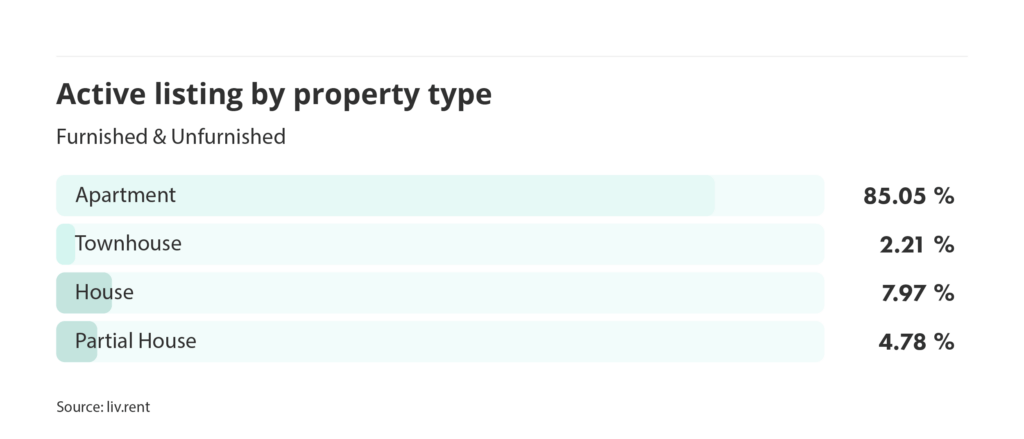
Active listings by property type
As of April 2025, the most common rental property type in the Greater Toronto Area was apartments, representing the majority of all listings in the GTA at 85.05%. Houses were the second most common unit type this month, representing 7.97% of active listings.
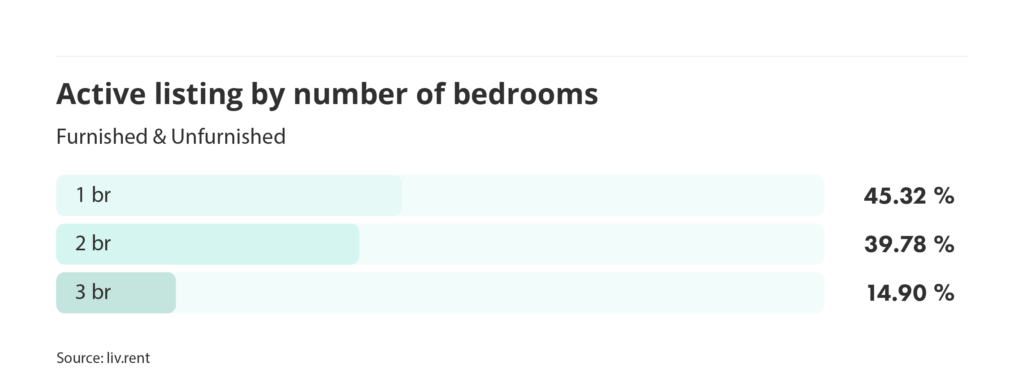
Active listings by number of bedrooms
In terms of the number of bedrooms, we saw a more even spread across active listings on the market this April. One-bedroom units were the most common type of listing in the GTA this month at 45.32%, while two-bedroom units represented 39.78% of the region’s active listings. Three-bedroom units make up the remaining 14.90%.
Looking for our full April 2025 Toronto Rent Report? Download your copy here to get all the latest insights, including a detailed breakdown by neighbourhood.
City breakdown
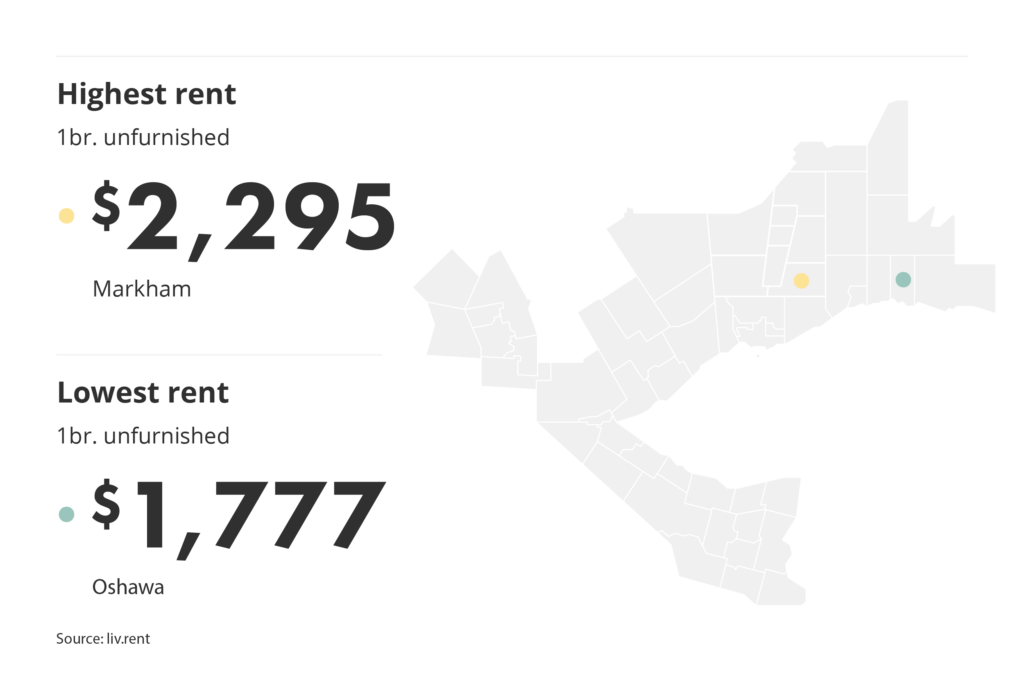
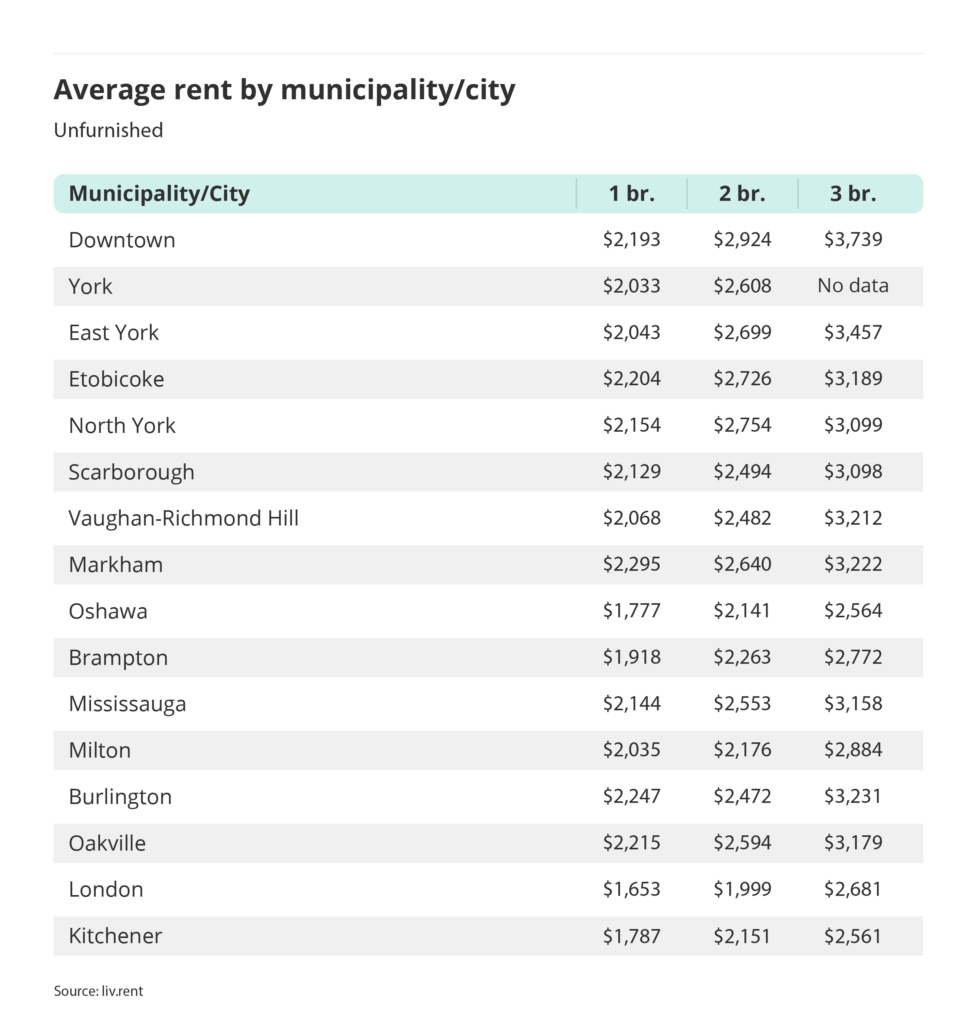
This April, Oshawa is the cheapest municipality to rent in out of the areas we look at for our Rent Reports, while Markham is the region’s most expensive place to rent this month.
The average rent price for an unfurnished one-bedroom unit in Oshawa currently stands at $1,777, while in Markham the same type of unit rents for an average of $2,295 – a difference of $518 between the two.
Read More: Rental Vacancy Rates In The City Of Toronto
Because Ontario’s different communities are so diverse, we’re breaking down the GTA into its different cities and municipalities to see the price difference within listing types: one-bedroom, two-bedroom, and three-bedroom units, both unfurnished and furnished.
- Prices decreased across all types of unfurnished units in Downtown, Mississauga, North York and Vaughan-Richmond Hill
- Brampton had the lowest average rental prices for all types of unfurnished units as well as one- and two-bedroom furnished units with Scarborough being the cheapest for three-bedroom furnished units.
- Markham and Scarborough saw prices increase for all types of unfurnished units this month.
Rental averages for other Ontario cities
We’ve also looked at data from cities and municipalities in other regions within and surrounding the GTA. Looking at these additional cities, London is the least expensive to rent in this April for one-bedroom unfurnished units. Markham is the most expensive for one-bedroom unfurnished units.
For complete data on these cities as well as other municipalities outside of the Greater Toronto Area, download our full report here to view the complete report.
Is your rental priced competitively?
Find out with a free rent estimate. Our team of rental experts will calculate your unit’s true value based on your listing details & current market trends.
Most expensive cities in Canada
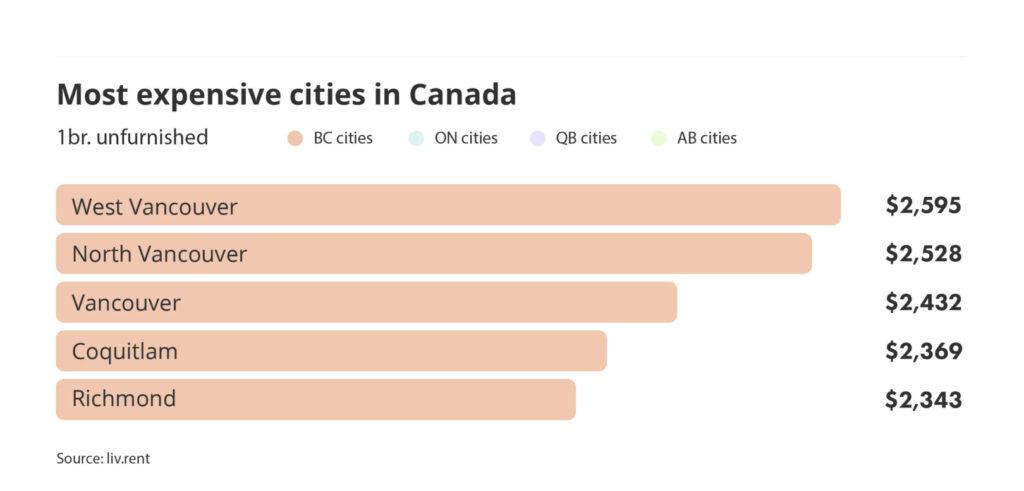
This April, none of the country’s five most expensive cities are located in the GTA. West Vancouver is the most expensive city in the country to rent in, followed by North Vancouver, Vancouver, Coquitlam and Richmond.
Downloadable resources
Our complete April 2025 Rent Report has information on even more key areas, broken down into region and unit type for a complete overview of rental averages in Ontario. To view these and all the other new information we’ve added, be sure to download your copy of the Rent Report below.
Download The Latest Toronto Rent Report
For the complete Toronto rent report, download here.
Renting in Ontario
For more information on renting in Ontario, refer to these comprehensive resource posts:
- What’s A Standard Rental Application?
- What do you need when applying for a rental?
- What Can A Landlord Ask For On A Rental Application In Ontario?
- How Do I Fill Out A Rental Application?
- Ontario Standard Lease Explained
- Frequently Asked Questions: Everything You Need to Know About Eviction in Ontario
Data collection methodology
Our monthly rent reports use data from our own liv.rent listings, as well as data our team manually collects from other popular listing sites – looking at available basement suites, apartments, condos, townhouses, semi-detached houses, and single-detached houses for each area.
When collecting this data, we do exclude luxury properties listed at over $5,000, as well as rooms for rent and shared accommodation. Investing in manual data collection means that we only consider the current month’s listing, since we can filter out duplicate listings and older ads that haven’t been removed.
Another key difference between our data collection methods and some government agencies like the CMHC is that we only include current asking rent prices. Many official reports will include data for entire buildings in their reports, which tends to skew numbers lower since many units are already occupied, and may be rent-controlled or rented for significantly lower than the current rates.
As we are a Canadian rental platform founded and based in Vancouver, we want to ensure that we’re providing a completely accurate depiction of the rental market in the cities we look at.
Rethink The Way You Rent
Not on liv.rent yet? Experience the ease of digital applications & contracts, verified tenants & landlords, virtual tours and more – all on one platform. Sign up for free or download the app.
Subscribe to receive these monthly updates on the Vancouver rental market. Discover last month’s Rent Reports below:
May 2024 Metro Vancouver Rent Report
May 2024 Toronto Rent Report
May 2024 Calgary & Edmonton Rent Report
May 2024 Montreal Rent Report


0 Comments