- The percentage of Vancouverites wearing shorts is up 46.00% for the month of April.
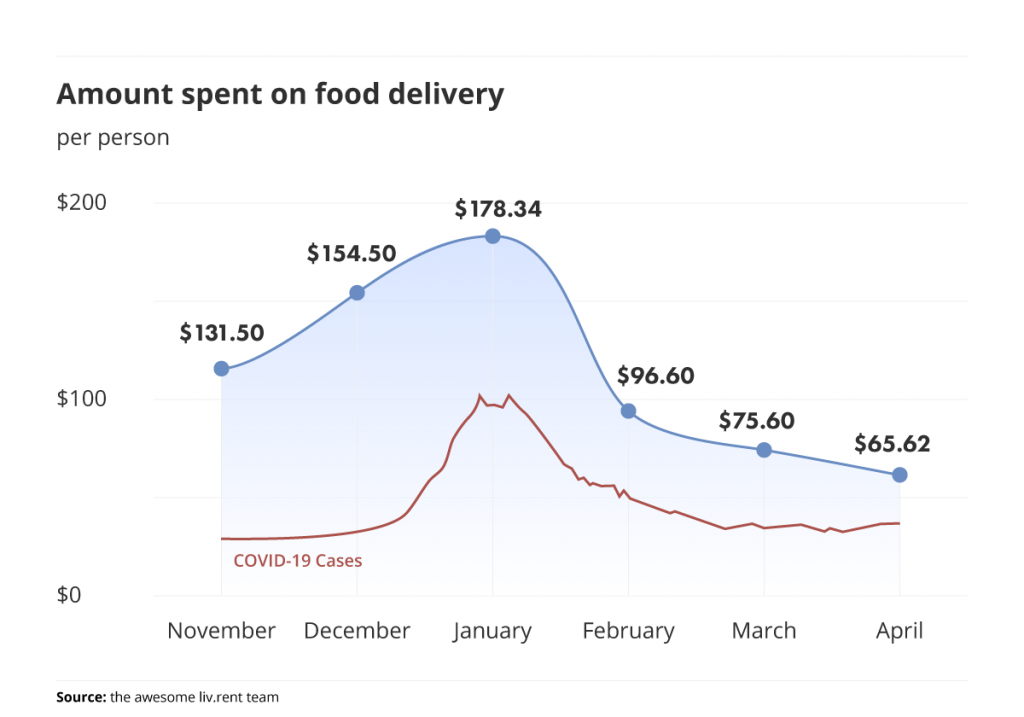
- The average Canadian is projected to spend just $65.62 on food delivery this month, down from $75.60 in March.
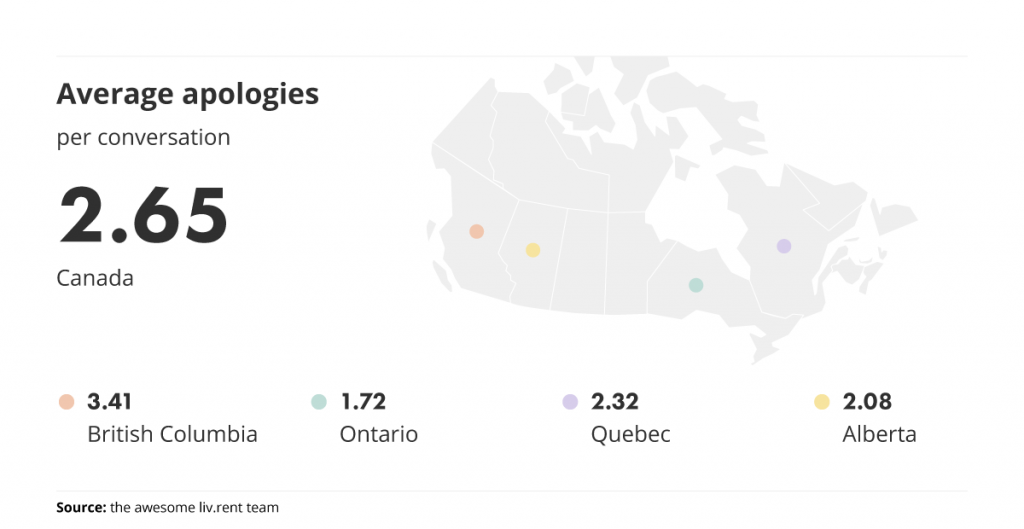
- The average conversation in B.C. contained 3.41 apologies, compared to Ontario’s 1.72.
For the first time, liv.rent brings you a very special Canada-wide Trend Report. This month, we’re breaking down the most pressing rental-related statistics from across the country – going beyond our usual data to give a sense of what really matters to renters and landlords across the country.
You can get the latest updates on Canada’s rental market straight to your inbox when you subscribe to keep on top of the trends.
Let’s take a look now at the latest data from across the country to see what’s really going on in Canada’s rental scene.
Jump to the following Canada Trend Report sections:
Is your rental priced competitively?
Find out with a free rent estimate. Our team of rental experts will calculate your unit’s true value based on your listing details & current market trends.
Disclaimer: The information in this report is entirely fictitious and not meant to be taken seriously. For accurate, up-to-date rental statistics for Vancouver, Toronto, and Montreal, be sure to check out our monthly rent reports.
Amount spend on food delivery
Following a busy winter for Canada’s food delivery services, Canadians have scaled back their spending on delivery meals this month. This April, the average Canadian is projected to spend just $65.62 on food delivery – that’s only about three sub sandwiches per person after fees and delivery charges, and nearly a third of January’s highs. Whether this decline is precipitated by gradually loosening restrictions on dining and social gatherings is still unclear, but we’ll be keeping an eye on the trends as they develop.
Change in seasonal attire
This chart breaks down the percentage change in warm-weather and cold-weather clothing items across Canada’s major cities.
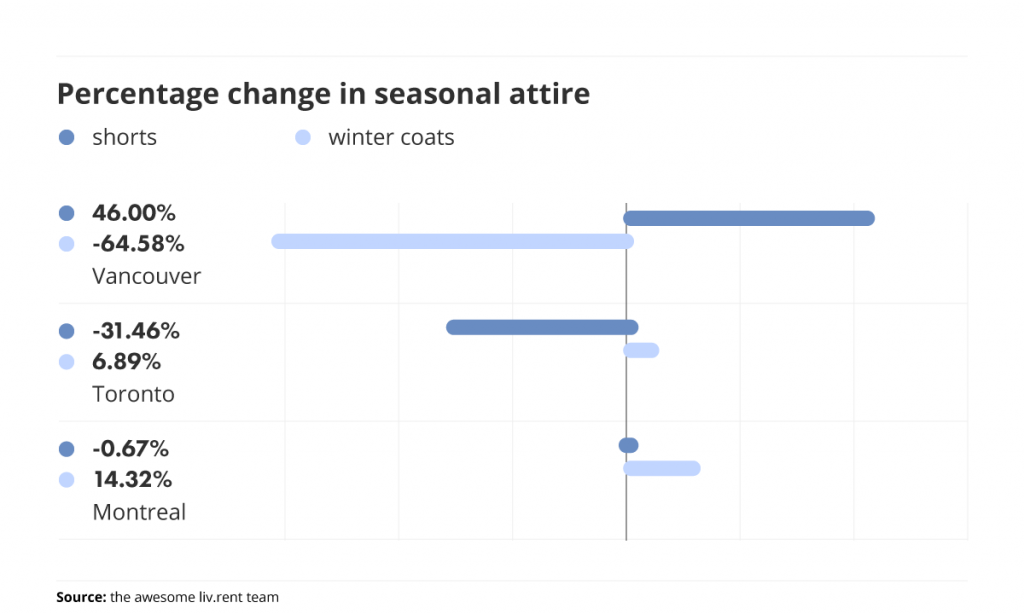
Shorts trends
The percentage of residents wearing shorts spiked in Vancouver this month as temperatures warmed on the West Coast – to the tune of a 46.00% increase. Toronto, on the other hand, isn’t quite ready to embrace summer yet as snow continues to fall across the GTA. We saw a short-lived spike of brave Ontarians trying their best to bare their legs last month, but April’s chilly temperatures have nipped that notion in the bud – shorts are down -31.46% this month. Over in Montreal, the percentage of shorts being worn hasn’t changed much as residents have grown used to leaving the house in pants, shorts are down just -0.67% in the city.
Winter coat trends
In Vancouver, winter coats are officially on their way out as optimistic British Columbians swap their jackets for t-shirts and their bobsleds for beers in the park. Toronto’s cold snap has seen an additional 6.89% of residents put their warm layers back on. In Montreal, winter coats are up a further 14.32% this month.
Average apologies
Canadians averaged 2.65 apologies per conversation for the month of April, with numbers varying across provinces. British Columbia had the most apologetic residents this month with a huge 3.41 apologies per conversation. Ontario surprisingly had the least apologies per conversation, with just 1.72.
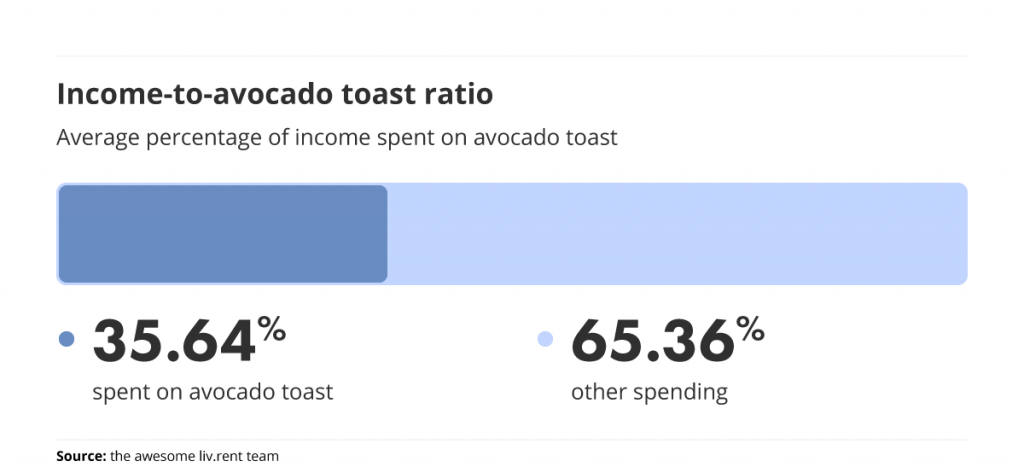
Income-to-avocado toast ratio
We’ve crunched the numbers, and it looks like the reports are right: Canadians are spending a huge portion of their monthly income on avocado toast. In fact, avocado toast accounted for 35.64% of the average Canadian’s spending this month, with just 65.36% of their income devoted to rent, bills, groceries, and other spending.
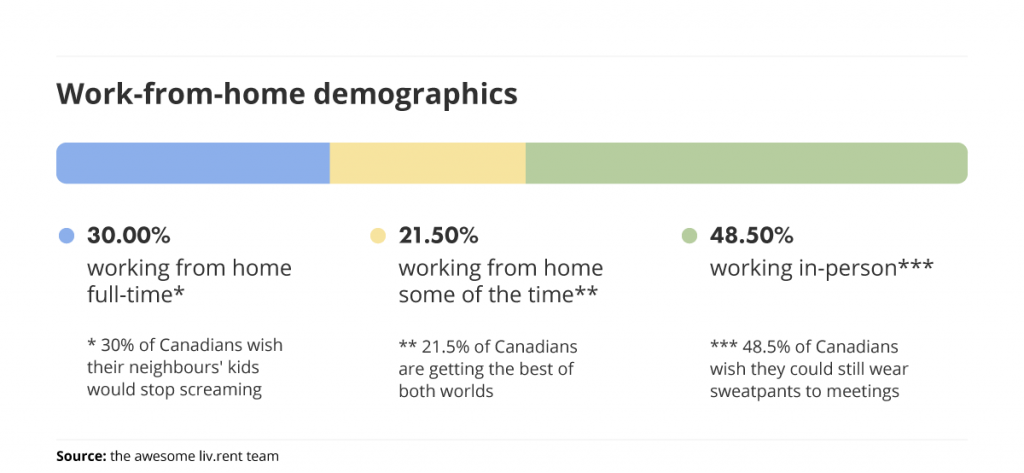
Work-from-home demographics
The majority of Canadians continue to work remotely at least some of the time, with a combined 51.50% still enjoying the comforts of home. Workplaces are continuing to open en masse though, with 48.50% of employees now working in person.
Coincidentally, we also found that 30.00% of Canadians are fed up with screaming children in their neighbourhood, and 100% of Canadians working in offices wish they could still wear sweatpants to meetings.
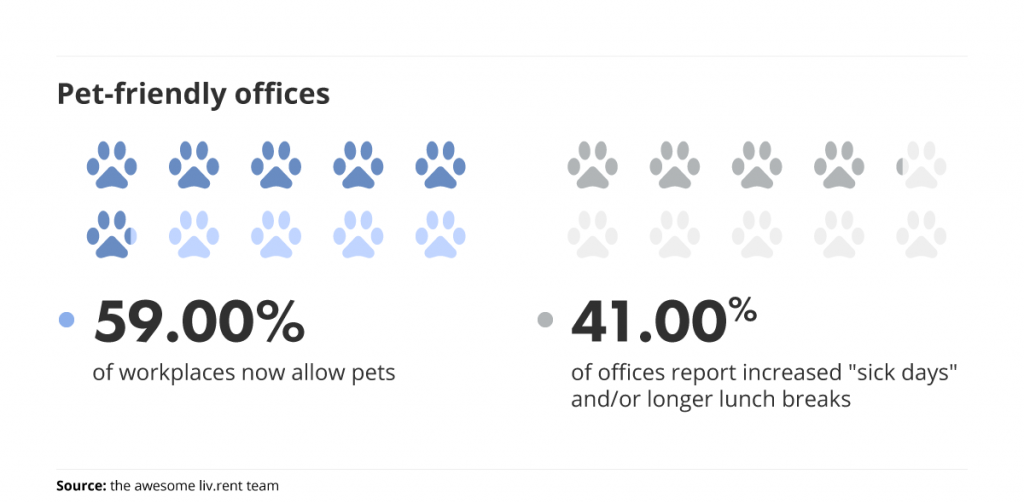
Pet-friendly offices
Happy April Fools’ day from all of us at liv.rent! If you’re looking for our real rent reports, you can view & download the latest reports for Vancouver, Toronto, and Montreal here.

Rethink The Way You Rent
Not on liv.rent yet? Experience the ease of digital applications & contracts, verified tenants & landlords, virtual tours and more – all on one platform. Sign up for free or download the app.
Subscribe to receive these monthly updates on the Toronto rental market. Discover last month’s Rent Reports below:
April 2022 Toronto Rent Report
April 2022 Vancouver Rent Report
April 2022 Montreal Rent Report




0 Comments