

At a glance
- Three-bedroom rents climb steadily in South Winnipeg
- South Winnipeg posted the strongest momentum in family-sized rentals, with unfurnished three-bedroom prices rising each month—$2,076 in September, $2,119 in October, and $2,140 in November. It was the only submarket to show consistent month-over-month growth through late 2025.
- South Winnipeg posted the strongest momentum in family-sized rentals, with unfurnished three-bedroom prices rising each month—$2,076 in September, $2,119 in October, and $2,140 in November. It was the only submarket to show consistent month-over-month growth through late 2025.
- St. Boniface remains Winnipeg’s most affordable rental area
- St. Boniface continues to offer the most affordable rents in the city, with unfurnished one-bedroom prices hovering between $1,089 and $1,164 over the three-month period.
- St. Boniface continues to offer the most affordable rents in the city, with unfurnished one-bedroom prices hovering between $1,089 and $1,164 over the three-month period.
- Opposing rent trends emerge between East Winnipeg and the North End
- East Winnipeg’s unfurnished one-bedroom rents dropped steadily this fall, while the North End’s climbed month after month. The two submarkets are now moving in opposite directions.
liv.rent’s 2025 Canada Rental Market Trend Report is now live! Explore the latest rental trends across Canada, uncover key factors driving price changes, and gain exclusive insights into how landlords and renters perceive the market nationwide. Download your copy here.
Average rent across Winnipeg
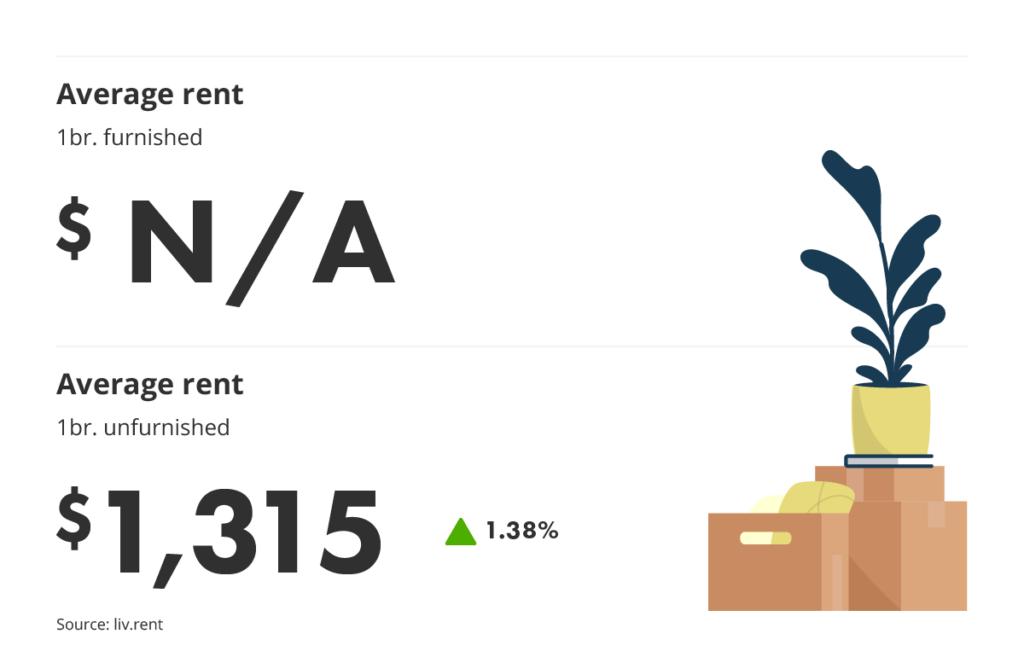
This month, the average rent price for an unfurnished one-bedroom unit was $1,315/month, well below rates in other major Canadian rental markets like Metro Vancouver and Toronto.
Is your rental priced competitively?
Find out with a free rent estimate. Our team of rental experts will calculate your unit’s true value based on your listing details & current market trends.
Month-to-month rent change
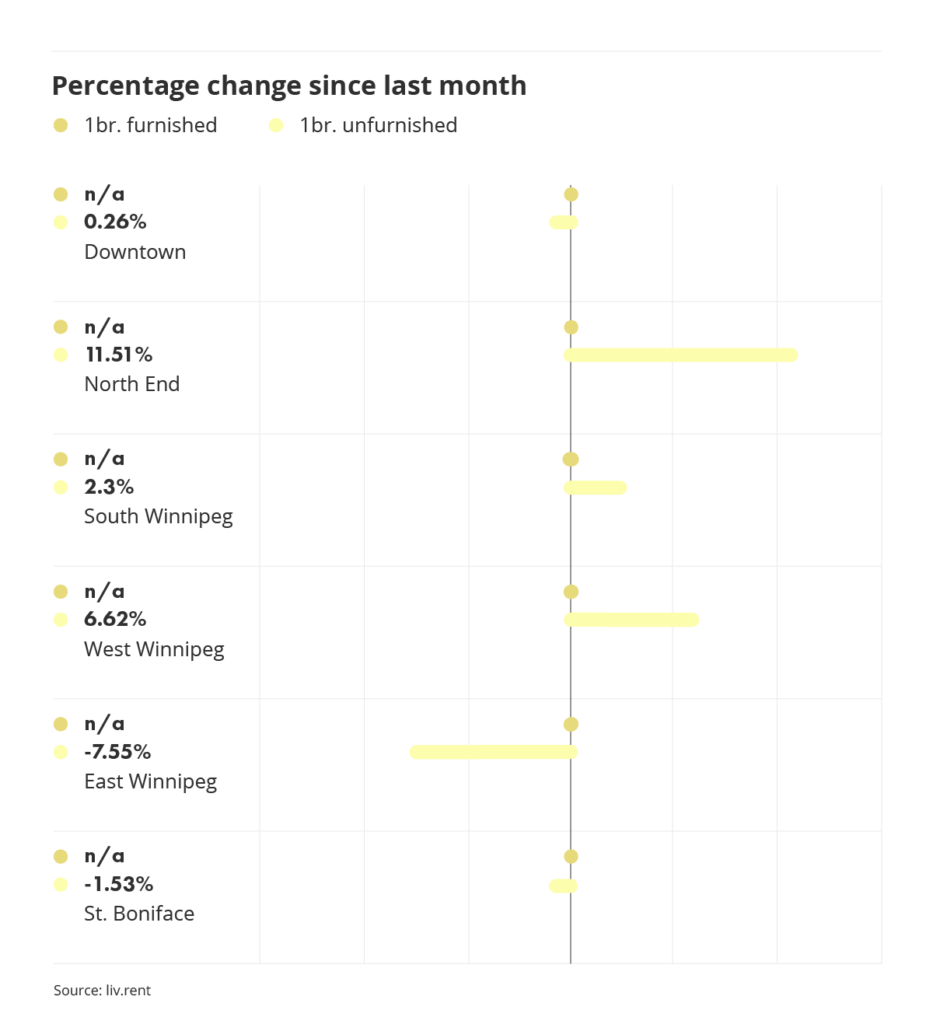
To better understand how rent prices have changed in Winnipeg, let’s look at the most significant changes for unfurnished one-bedroom units this month.
Several areas saw notable changes in average rent prices this month. Looking at unfurnished one-bedroom units, North End saw the largest increase (+11.51%), while East Winnipeg saw the biggest decline (-7.55%).
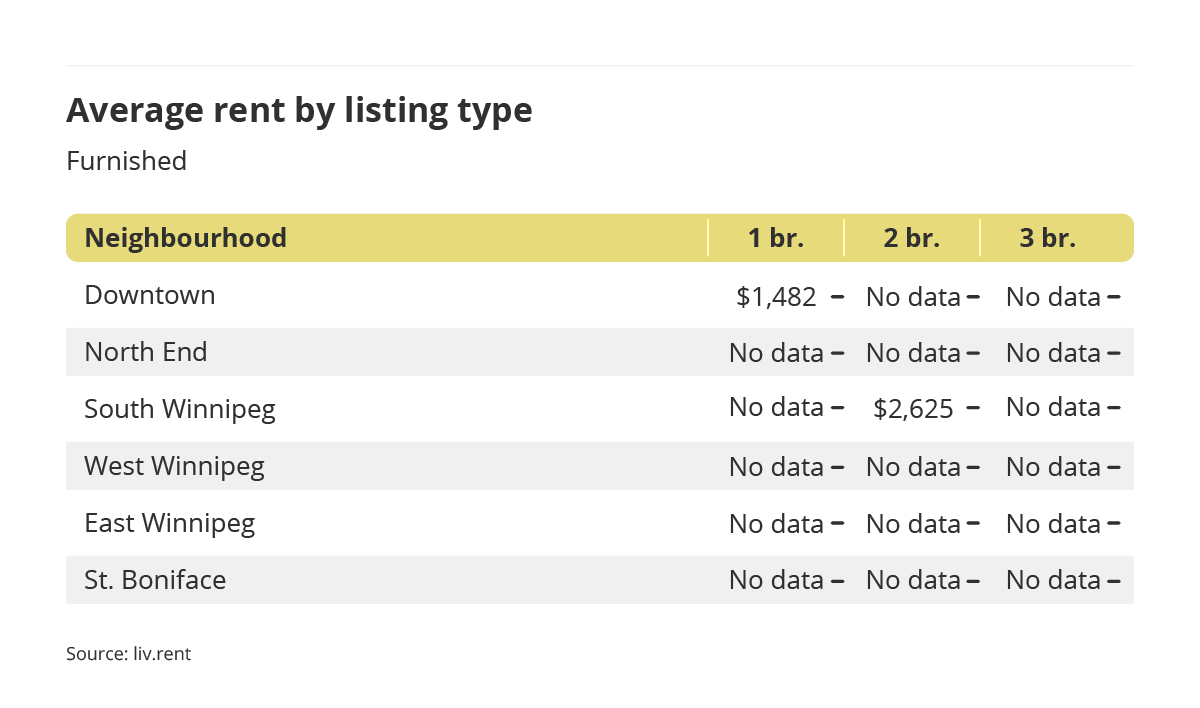
Winnipeg unfurnished vs. furnished rent averages
This November, average monthly rent prices for one-bedroom unfurnished units rose by +1.38% to $1,315/month.
Is your rental priced competitively?
Find out with a free rent estimate. Our team of rental experts will calculate your unit’s true value based on your listing details & current market trends.
Looking for our full November 2025 Winnipeg Rent Report? Download your copy here to get all the latest insights, including a detailed breakdown by neighbourhood.
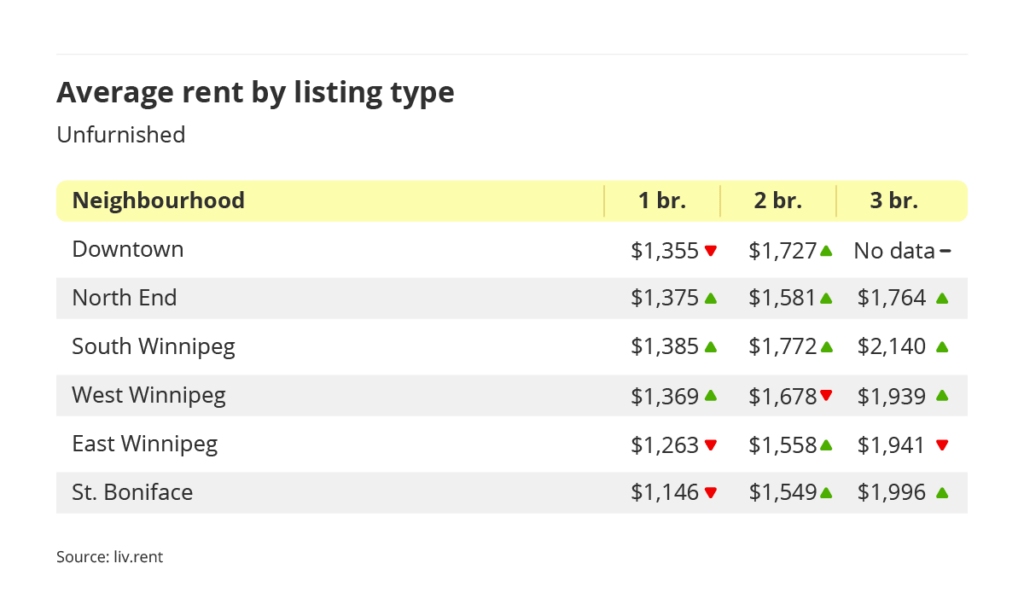
Neighbourhood breakdown
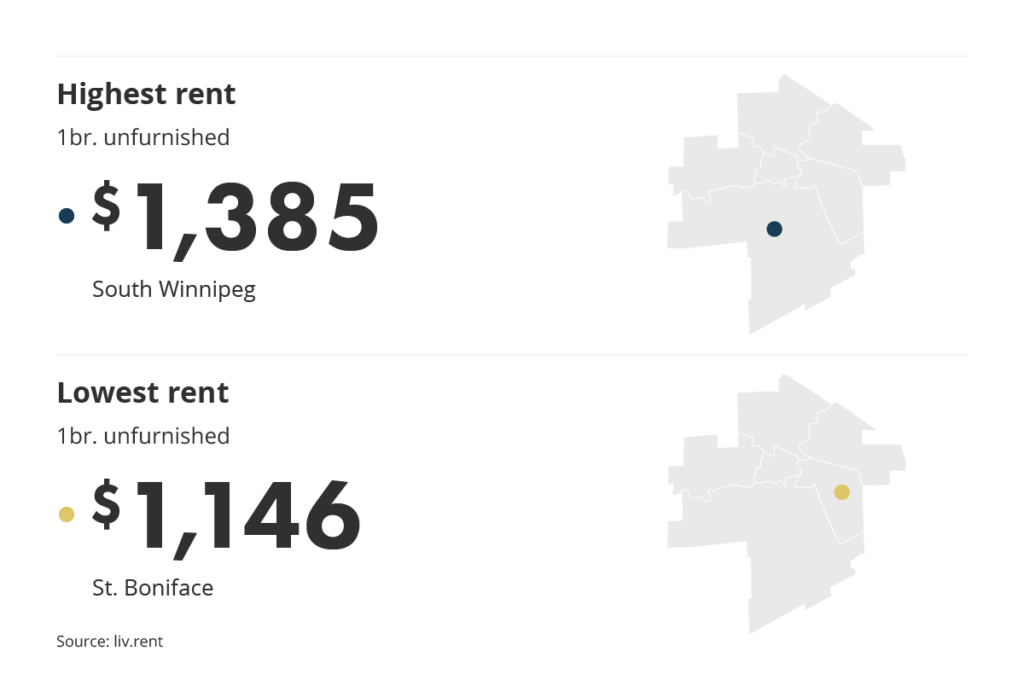
Winnipeg’s most and least expensive neighbourhoods had different average rent prices this November. This month, St. Boniface is Winnipeg’s cheapest neighbourhood to rent in at an average of $1,146/month for an unfurnished one-bedroom unit. Meanwhile, South Winnipeg is the most expensive neighbourhood, at an average of $1,385/month – $239 more than in St. Boniface.
Let’s look even closer at the different listing types to see the differences in one-, two-, and three-bedroom rental rates across each area.
- All unfurnished two-bedroom rent prices increased across Winnipeg neighbourhoods except West Winnipeg.
- All unfurnished three-bedroom rent prices increased across Winnipeg neighbourhoods except East Winnipeg.
- All unfurnished rental types in North End and South Winnipeg increased in price.
Is your rental priced competitively?
Find out with a free rent estimate. Our team of rental experts will calculate your unit’s true value based on your listing details & current market trends.
Be sure to subscribe to our mailing list so you never miss an update on the Winnipeg rental market.
Downloadable Resources
Data collection methodology
Our monthly rent reports use data from our own liv.rent listings, as well as data our team manually collects from other popular listing sites – looking at available basement suites, apartments, condos, townhouses, semi-detached houses, and single-detached houses for each area.
When collecting this data, we do exclude luxury properties listed at over $5,000, as well as rooms for rent and shared accommodation. Investing in manual data collection means that we only consider the current month’s listing, since we can filter out duplicate listings and older ads that haven’t been removed.
Another key difference between our data collection methods and some government agencies like the CMHC is that we only include current asking rent prices. Many official reports will include data for entire buildings in their reports, which tends to skew numbers lower since many units are already occupied, and may be rent-controlled or rented for significantly lower than the current rates.
As we are a Canadian rental platform founded and based in Vancouver, we want to ensure that we’re providing a completely accurate depiction of the rental market in the cities we look at.
Rethink The Way You Rent
Not on liv.rent yet? Experience the ease of digital applications & contracts, verified tenants & landlords, virtual tours and more – all on one platform. Sign up for free or download the app.
Subscribe to receive monthly updates on Canada’s major rental markets. Discover last month’s Rent Reports below:
Vancouver Rent Report
Ontario Rent Report
Montreal Rent Report
Calgary and Edmonton Rent Report

0 Comments