This month, we take a look at the state of the rental market in Greater Vancouver. Below is a breakdown of this month’s Vancouver rental stats.
Vacancy Rates February 2019
Vancouver properties continue to demand the highest rents and vacancy rates are still hovering around the 1% mark across the Lower Mainland.

Average Rental Rates
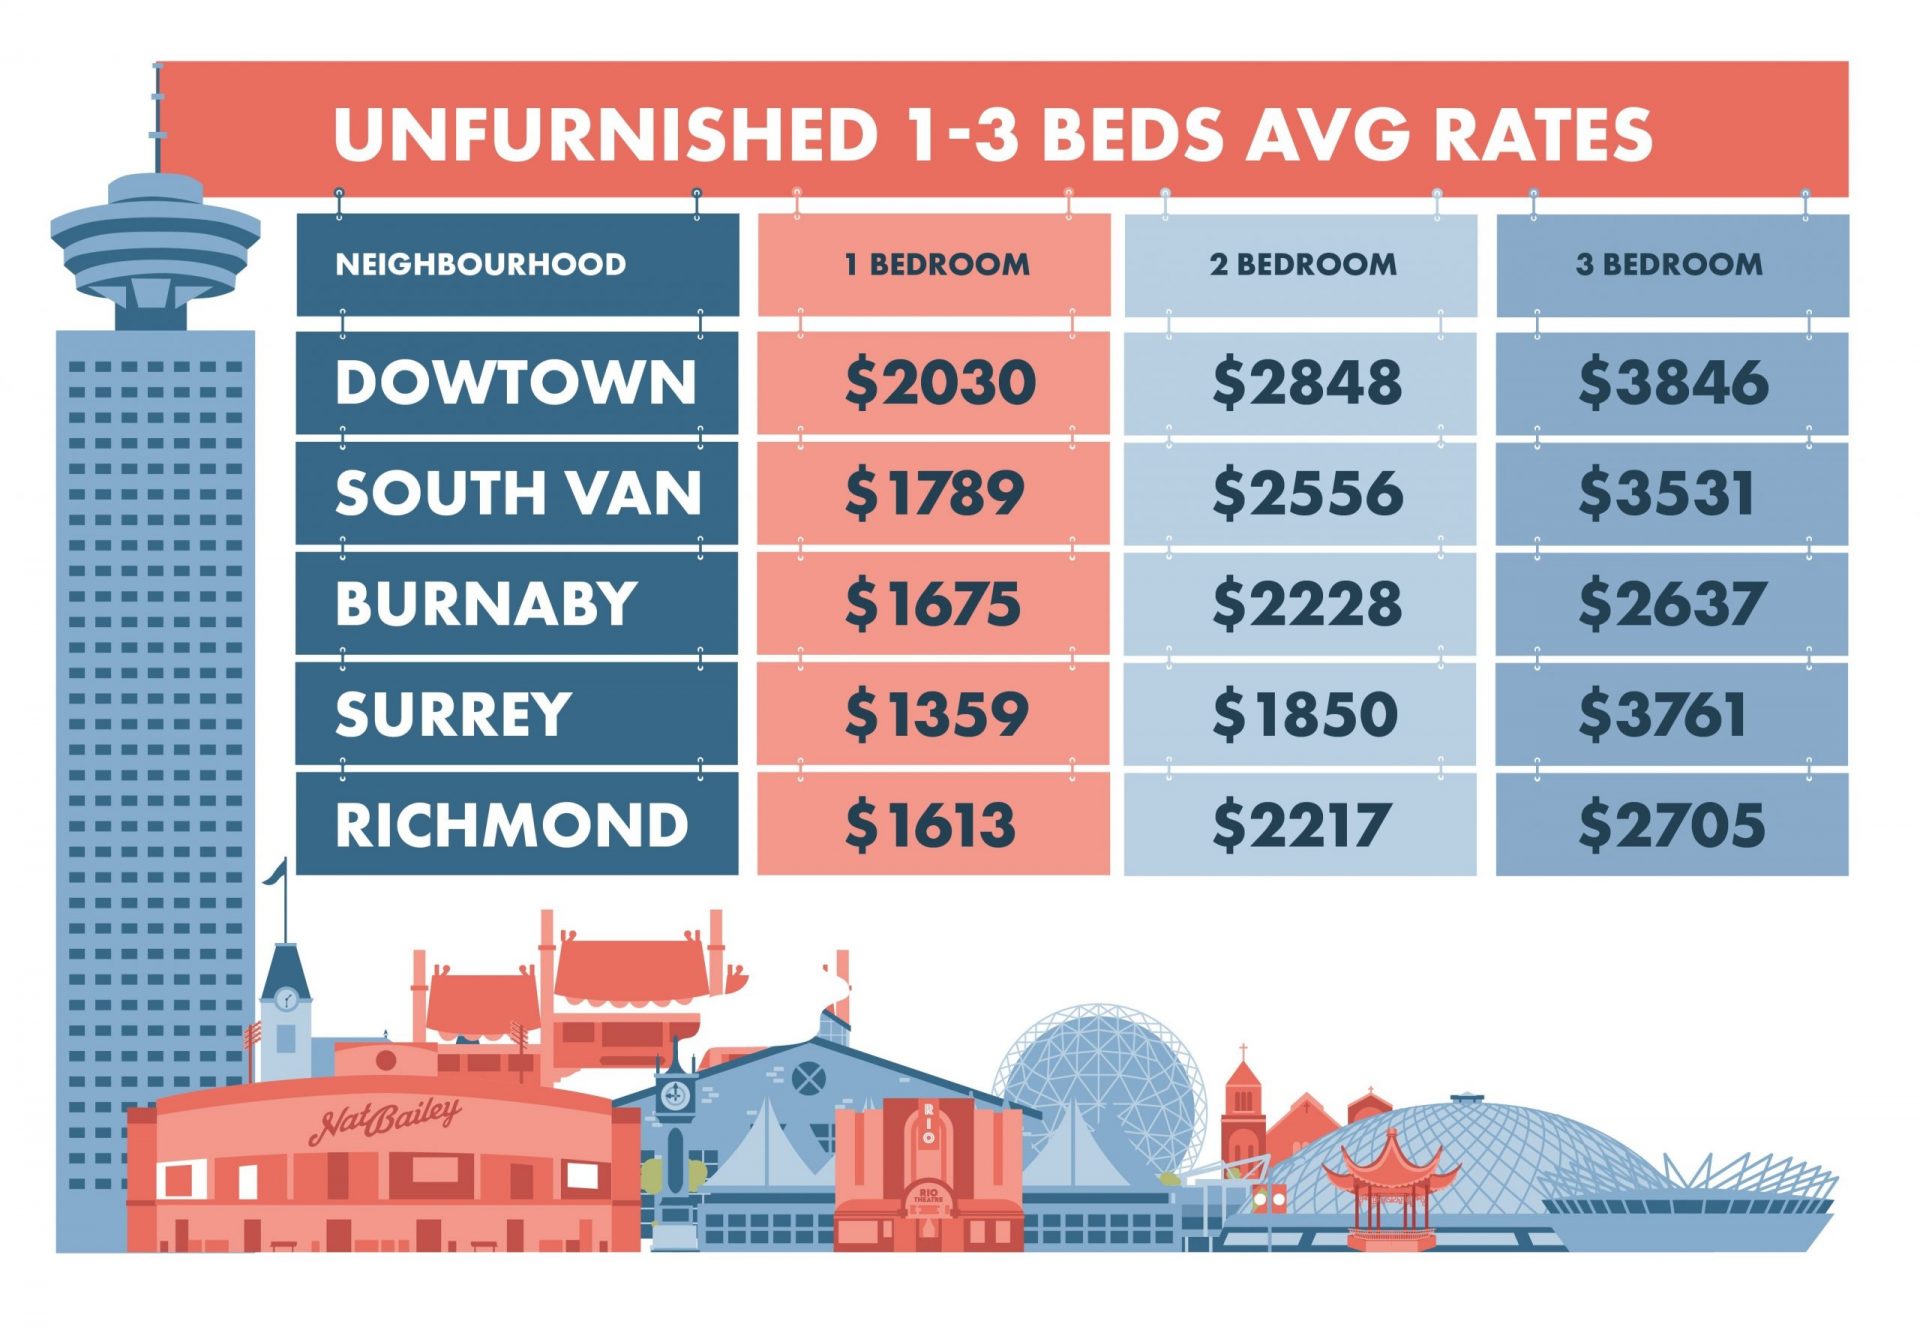
Have a look at 1,2,3 bedroom averages. It may make sense to add another bedroom and find a roommate.
SOURCE: FEBRUARY 2019 STATISTICS – LIV.RENT AND VARIOUS ONLINE SOURCES
Vancouver Renter Stats – Demographics
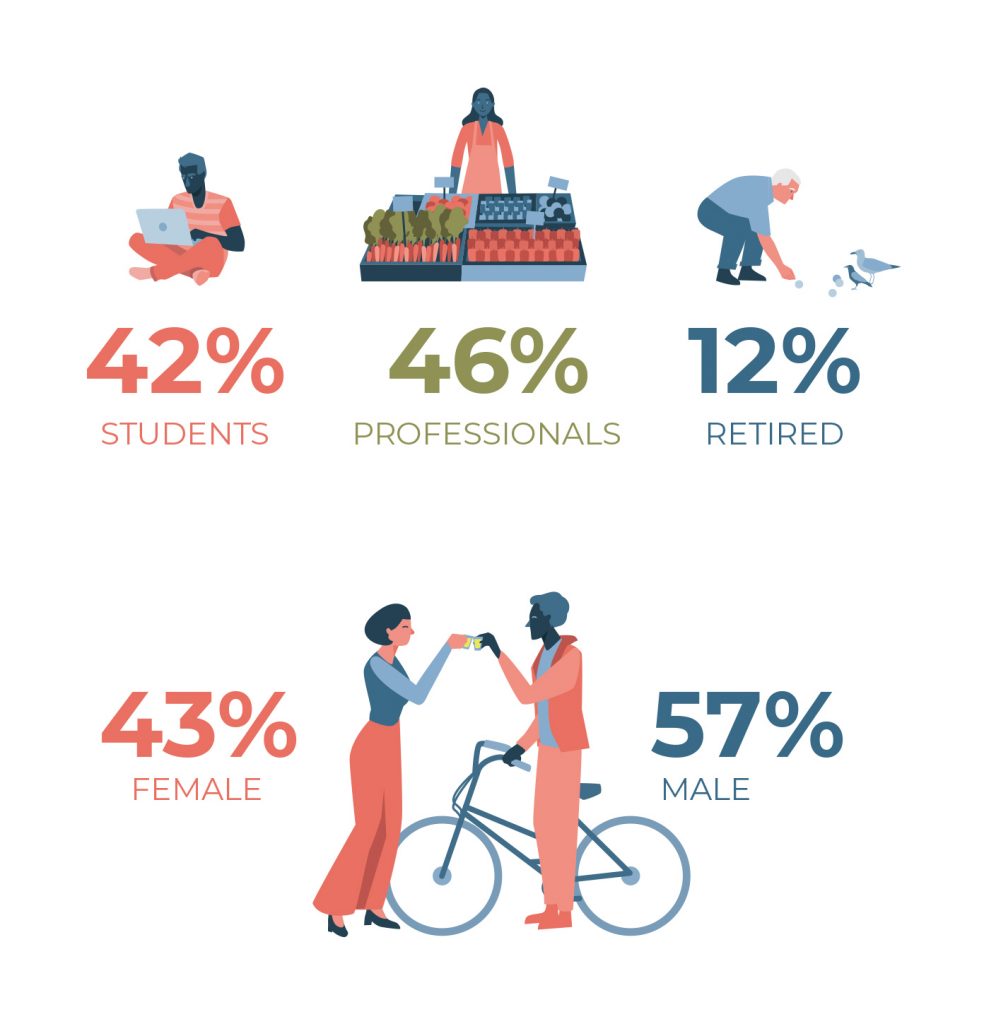
In February 2019, more men are actively seeking a rental property than women, with the largest percentage of renters unsurprisingly being working professionals or students at 46% and 42% respectively.
Pet Friendly Vancouver Rental Stats
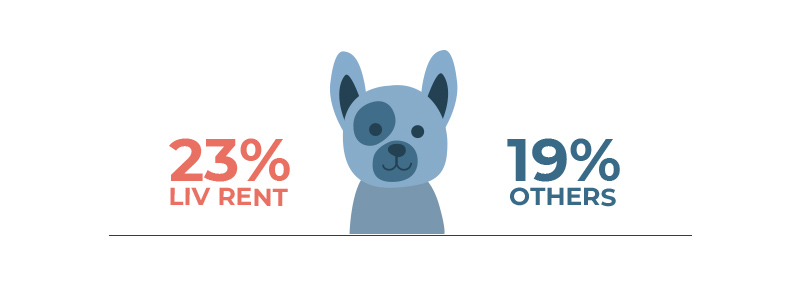
Finding accommodation when you have a furry friend remains a challenge for Greater Vancouverites. When looking at the volume of listings online, 23% of liv.rent listings are pet friendly compared to 19% of listings on other platforms.
Furnished vs. Unfurnished Rentals Stats
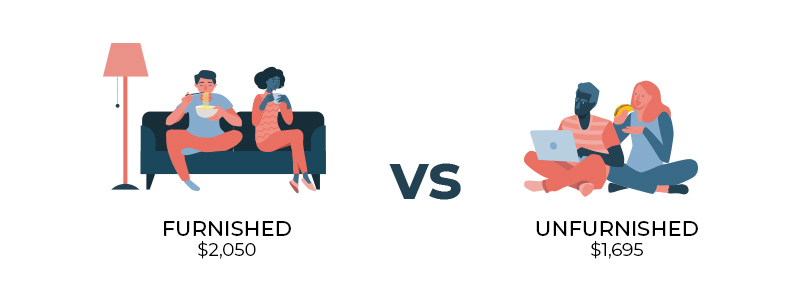
Choosing to rent furnished vs unfurnished continues to be a value assumption equation when it comes to pricing. The average rent for a furnished one bedroom apartment in February was $2,050 per month, while the unfurnished average was $1,695.
Highest vs. Cheapest Rent in Vancouver
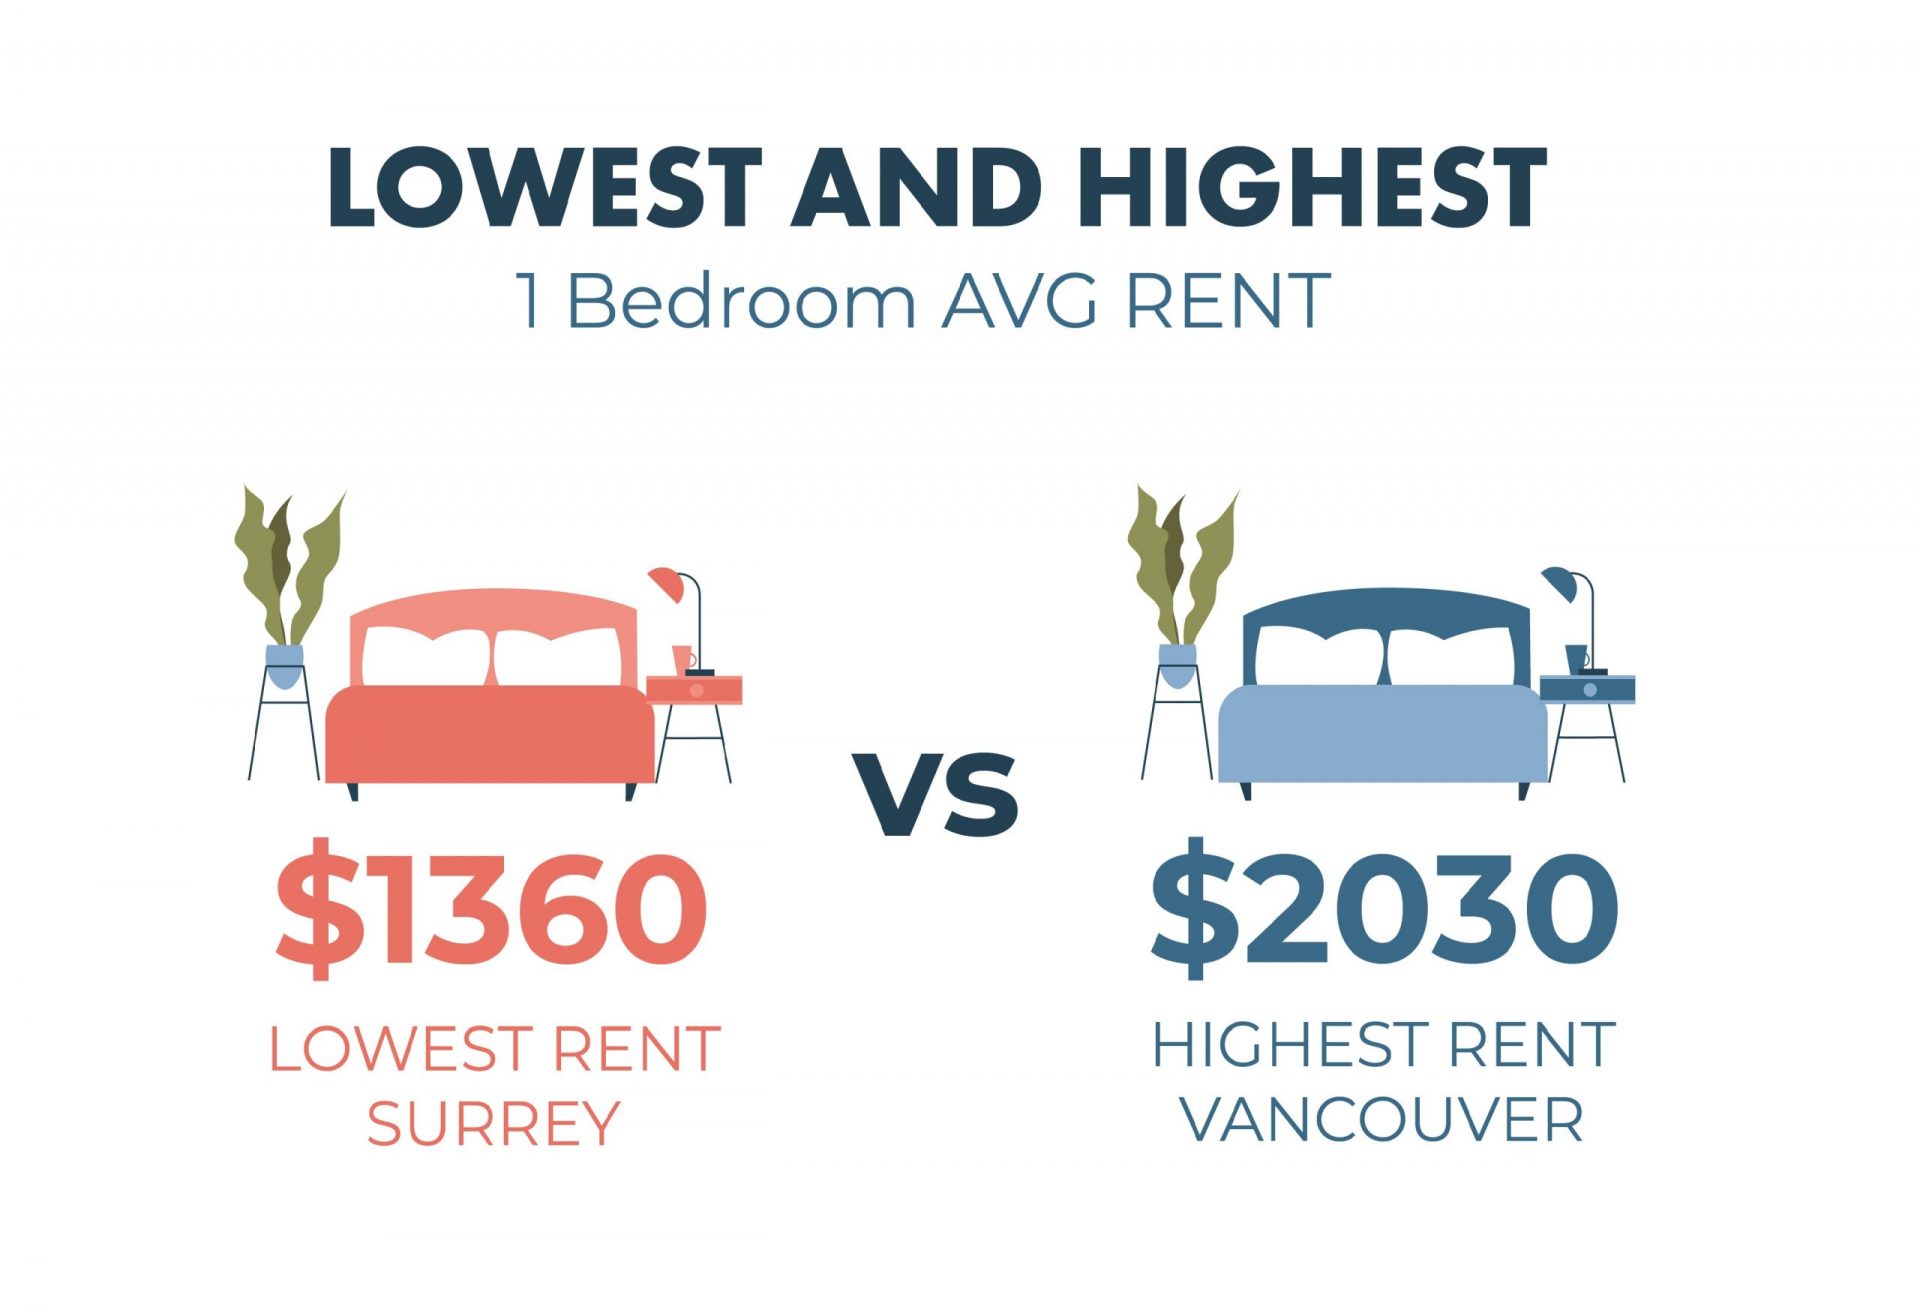
Surrey has the lowest average rent for a 1 bedroom unit at $1360 compared to Downtown Vancouver’s average of $2030 for a comparable apartment.
 Remember though, despite paying premium rates to live in Vancouver, tenants are saving in other ways, primarily, on car-related expenses (vehicle, insurance, fuel and repairs). In addition, time is money, and living near where you work pays mental health dividends in terms of reduced commuting times and associated stress.
Get all the February stats
Download the summarized version here.
Stay tuned for our March numbers!
Follow us on Instagram for monthly rental stats in other major metropolitan cities.



0 Comments