

At a glance
- East Winnipeg sees the steepest decline
- East Winnipeg recorded the largest drop in Winnipeg, with 1-bed rents falling 11.0% since January ($1,269 → $1,130), marking the biggest shift across all neighborhoods
- East Winnipeg recorded the largest drop in Winnipeg, with 1-bed rents falling 11.0% since January ($1,269 → $1,130), marking the biggest shift across all neighborhoods
- St. Boniface leads rent growth in 2026
- St. Boniface saw the strongest increase, with 1-bed rents rising 4.5% since January ($1,209 → $1,263), followed by South Winnipeg at +3.4%
- St. Boniface saw the strongest increase, with 1-bed rents rising 4.5% since January ($1,209 → $1,263), followed by South Winnipeg at +3.4%
- Larger units drive the biggest rent swings
- 2-bedroom rents saw the most volatility, with South Winnipeg rising 9.7% month over month ($1,636 → $1,794), while 1-bedroom rents remained relatively stable across most areas
- 2-bedroom rents saw the most volatility, with South Winnipeg rising 9.7% month over month ($1,636 → $1,794), while 1-bedroom rents remained relatively stable across most areas
Download liv.rent’s 2026 Canada Rental Market Trends Report for in-depth insights and forecasts on average rent prices, regional market comparisons, key economic drivers, and emerging AI trends shaping Canada’s rental landscape.
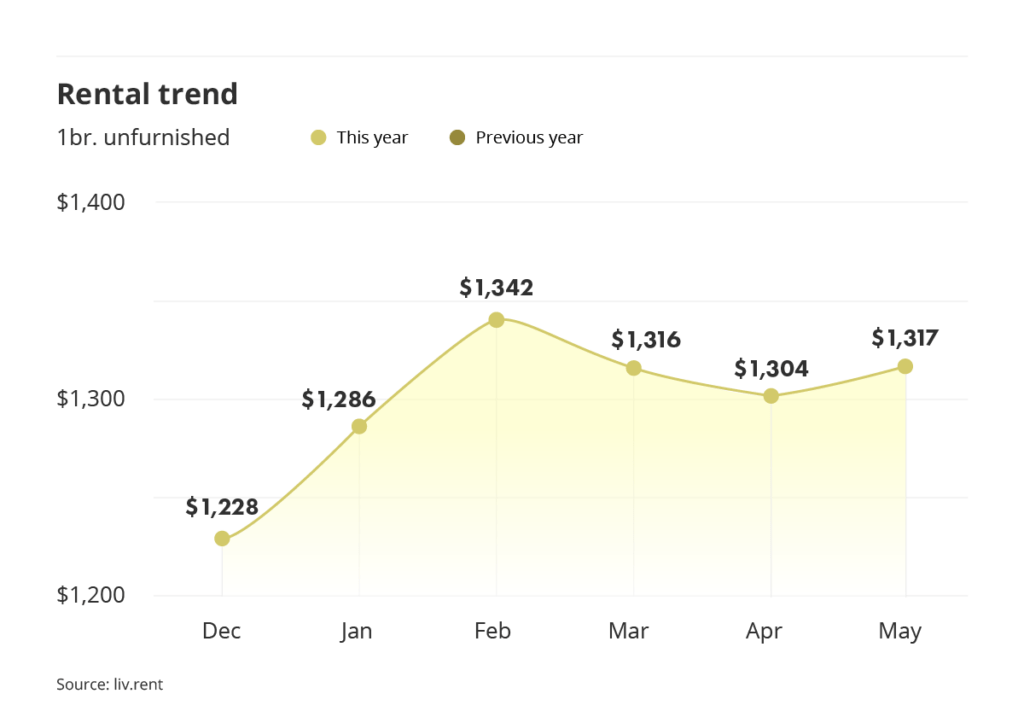
Average rent across Winnipeg
This month, the average rent for an unfurnished one-bedroom unit was $1,317/month, keeping it well below prices in other major Canadian rental markets like Metro Vancouver and Toronto. Compared to last month, unfurnished one-bedroom rent in May increased by $13.
Is your rental priced competitively?
Find out with a free rent estimate. Our team of rental experts will calculate your unit’s true value based on your listing details & current market trends.
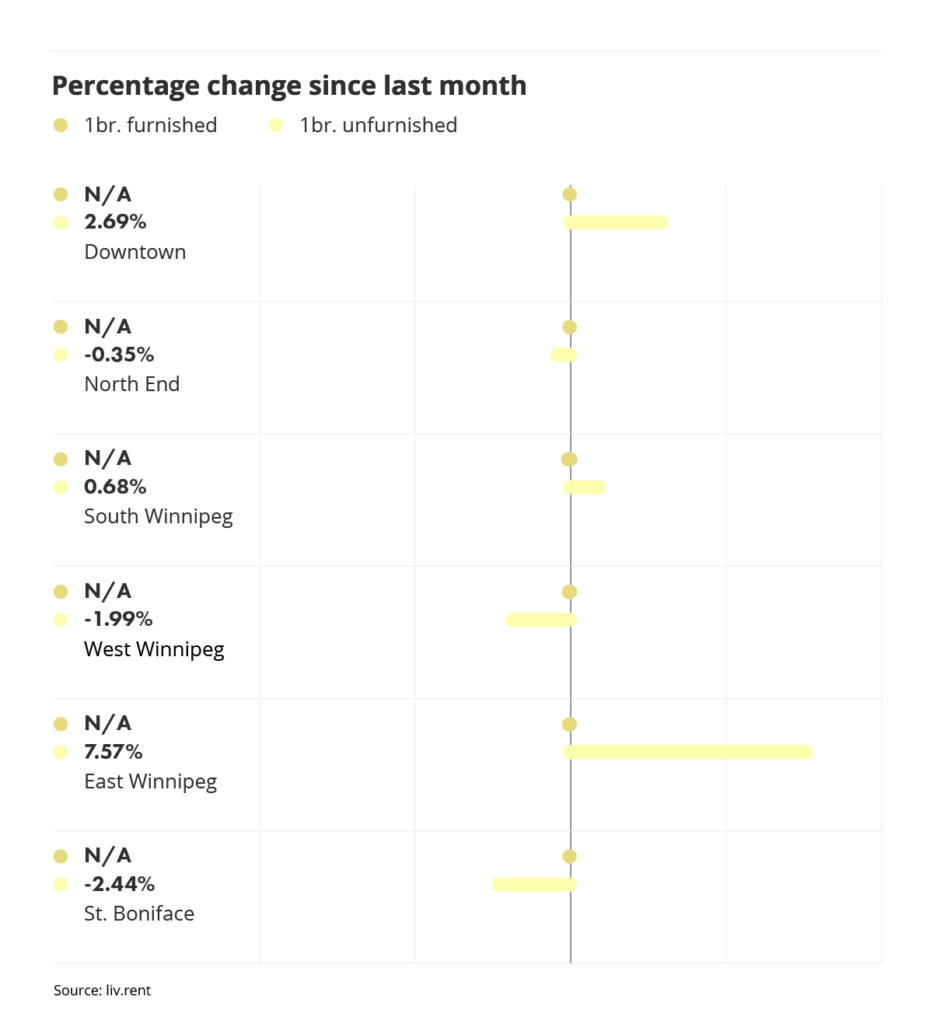
Month-to-month rent change
To better understand how rent prices have changed in Winnipeg, let’s look at the most significant changes for unfurnished one-bedroom units this month.
St. Boniface (-2.44%) and West Winnipeg (-1.99%) saw the largest decreases, while East Winnipeg (+7.57%) saw the largest increase.
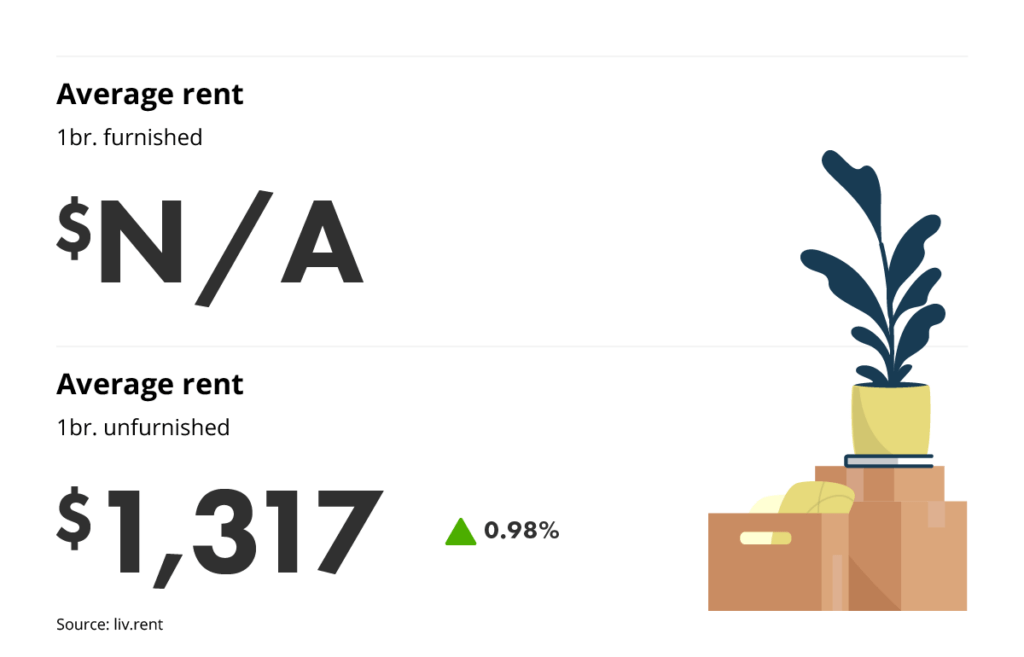
Winnipeg unfurnished vs. furnished rent averages
This May, average monthly rent prices for unfurnished one-bedroom units increased (+0.98%) to $1,317/month.
Is your rental priced competitively?
Find out with a free rent estimate. Our team of rental experts will calculate your unit’s true value based on your listing details & current market trends.
Looking for our full May 2026 Winnipeg Rent Report? Download your copy here to get all the latest insights, including a detailed breakdown by neighbourhood.
Neighbourhood breakdown
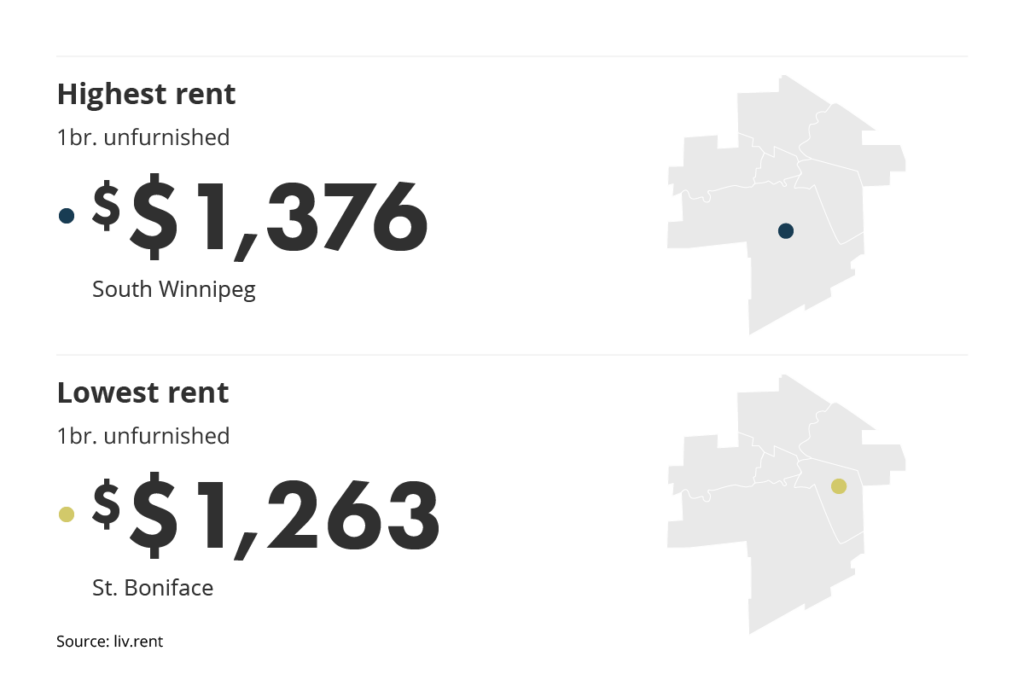
Winnipeg’s most and least expensive neighbourhoods had slightly different average rent prices this May. This month, St. Boniface is the cheapest neighbourhood to rent in at an average of $1,263/month for an unfurnished one-bedroom unit. Meanwhile, South Winnipeg is the most expensive neighbourhood, at an average of $1,376/month – $113 more than in St. Boniface.
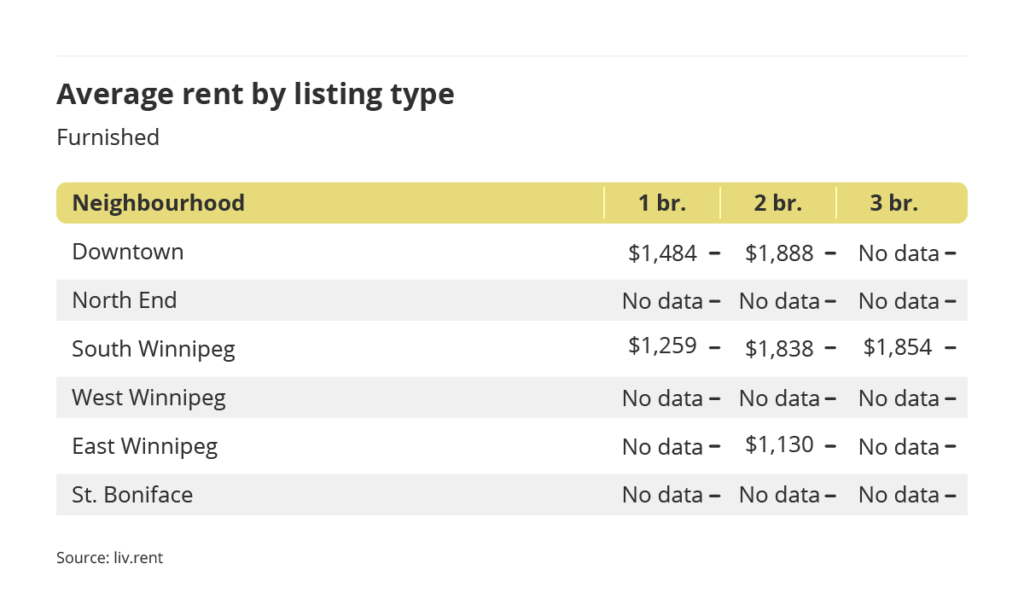
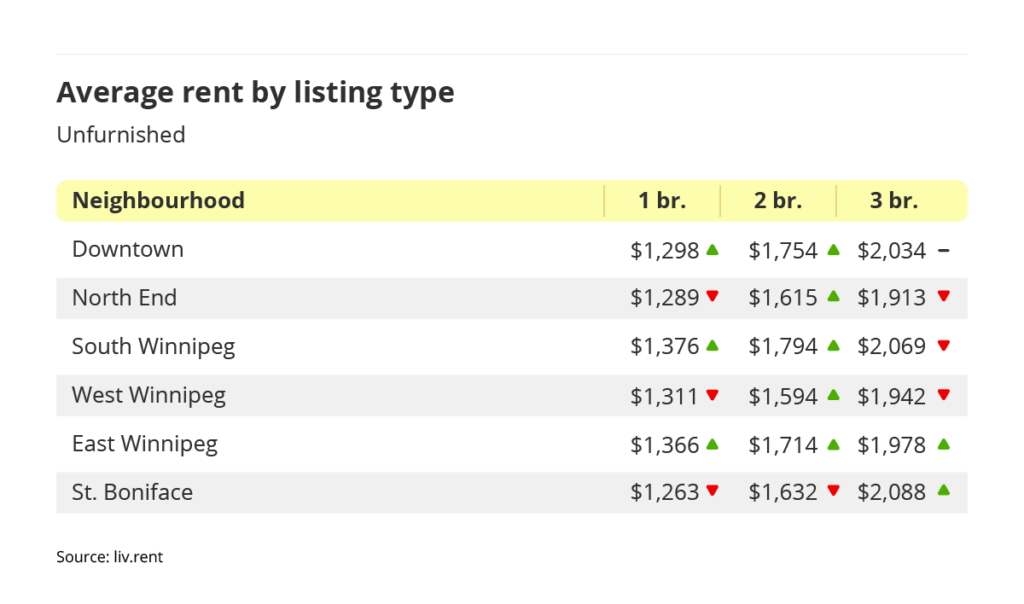
Let’s look even closer at the different listing types to see the differences in one-, two-, and three-bedroom rental rates across each area.
- Half of unfurnished one-bedroom rent prices decreased across Winnipeg neighbourhoods, including St. Boniface (-2.44%), West Winnipeg (-1.99%), and Winnipeg North End (-0.35%).
- All types of unfurnished rental units increased in East Winnipeg.
- Unfurnished two-bedroom rent price increased across all neighbourhoods except St. Boniface.
Is your rental priced competitively?
Find out with a free rent estimate. Our team of rental experts will calculate your unit’s true value based on your listing details & current market trends.
Be sure to subscribe to our mailing list so you never miss an update on the Winnipeg rental market.
Downloadable Resources
Data collection methodology
Our monthly rent reports use data from our own liv.rent listings, as well as data our team manually collects from other popular listing sites – looking at available basement suites, apartments, condos, townhouses, semi-detached houses, and single-detached houses for each area.
When collecting this data, we do exclude luxury properties listed at over $5,000, as well as rooms for rent and shared accommodation. Investing in manual data collection means that we only consider the current month’s listing, since we can filter out duplicate listings and older ads that haven’t been removed.
Another key difference between our data collection methods and some government agencies like the CMHC is that we only include current asking rent prices. Many official reports will include data for entire buildings in their reports, which tends to skew numbers lower since many units are already occupied, and may be rent-controlled or rented for significantly lower than the current rates.
As we are a Canadian rental platform founded and based in Vancouver, we want to ensure that we’re providing a completely accurate depiction of the rental market in the cities we look at.
Rethink The Way You Rent
Not on liv.rent yet? Experience the ease of digital applications & contracts, verified tenants & landlords, virtual tours and more – all on one platform. Sign up for free or download the app.
Subscribe to receive monthly updates on Canada’s major rental markets. Discover last month’s Rent Reports below:
Vancouver Rent Report
Ontario Rent Report
Montreal Rent Report
Calgary and Edmonton Rent Report

0 Comments