This month we take a look at the state of the rental market in Greater Vancouver based on April’s figures. Below is a breakdown of this month’s Vancouver rental stats.
Vancouver Renter Stats – Demographics
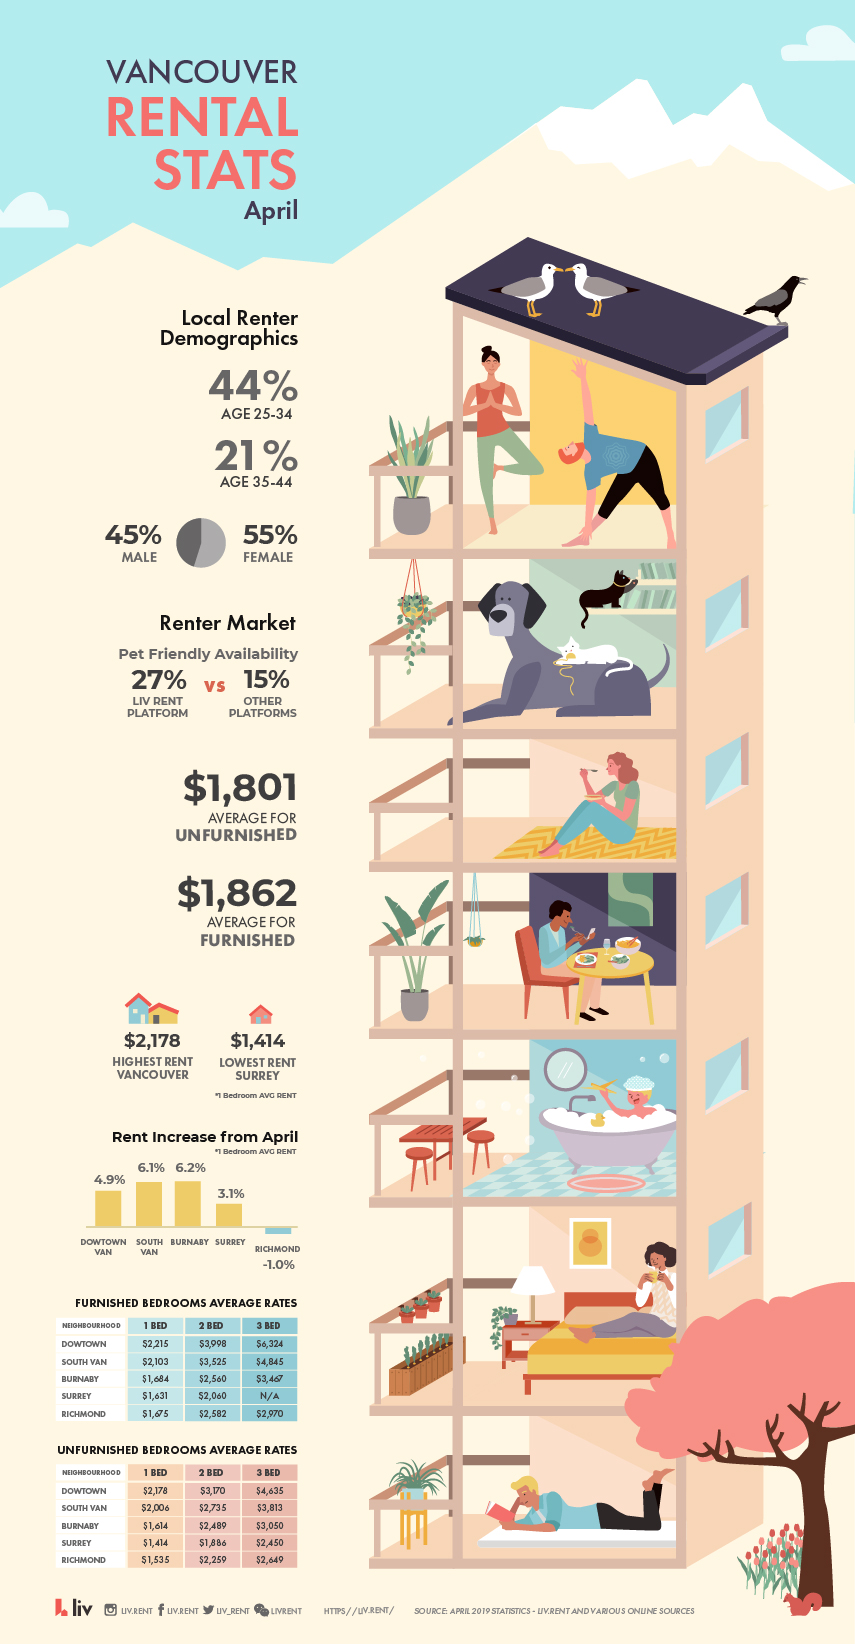
In April 2019, again more women were actively seeking a rental property than men – 55% and 45 respectively, as was the case in March. And the large majority of rental seekers – 44% – fall into the 25-34 year old category.

Pet Friendly Vancouver Rentals
Finding accommodations when you have a furry friend remains a challenge for Greater Vancouverites. When looking at the volume of listings online, more than a quarter (27%) of liv.rent listings were pet friendly compared to 15% of listings on other platforms.

Furnished vs. Unfurnished Rental Stats
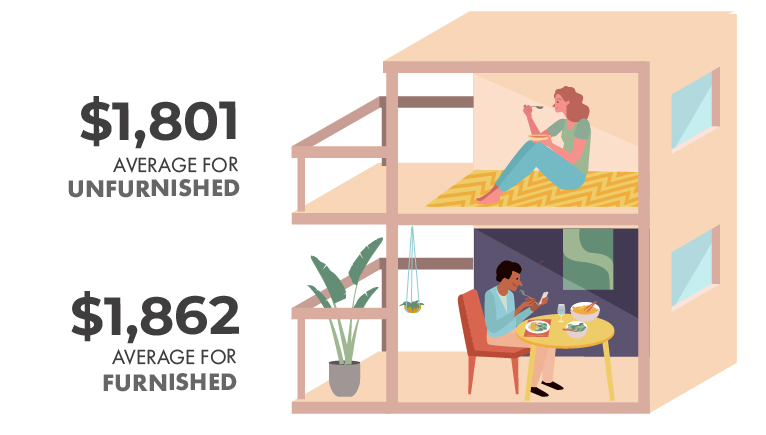
Interestingly, the price differential between furnished and unfurnished rental options closed a little in April. The average rent for an unfurnished one bedroom apartment in April was $1,801 per month up from March’s $1,682 average. The average cost of a furnished apartment, however, crept downwards to $1,862 from March’s $1,930.
Highest vs. Cheapest Rent in Vancouver
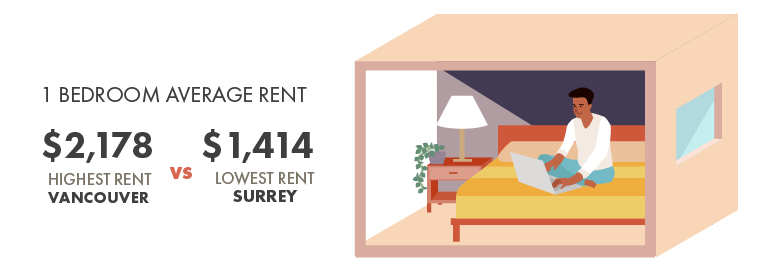
Surrey continues to have the lowest average rent for a 1 bedroom unit at $1,414 compared to Downtown Vancouver’s average of $2,178 for a comparable home.
Remember though, despite paying premium rates to live in Vancouver, tenants are saving in other ways, primarily, on car-related expenses (vehicle, insurance, fuel and repairs). In addition, time is money, and living near where you work pays mental health dividends in terms of reduced commuting times and associated stress.
Be sure to subscribe to our mailing list for all future updates on the Vancouver rental market!
For more rental stats, read our previous post, Vancouver Rental Stats – March 2019 Snapshot.
Follow us on Instagram for monthly rental stats in other major metropolitan cities.



0 Comments