

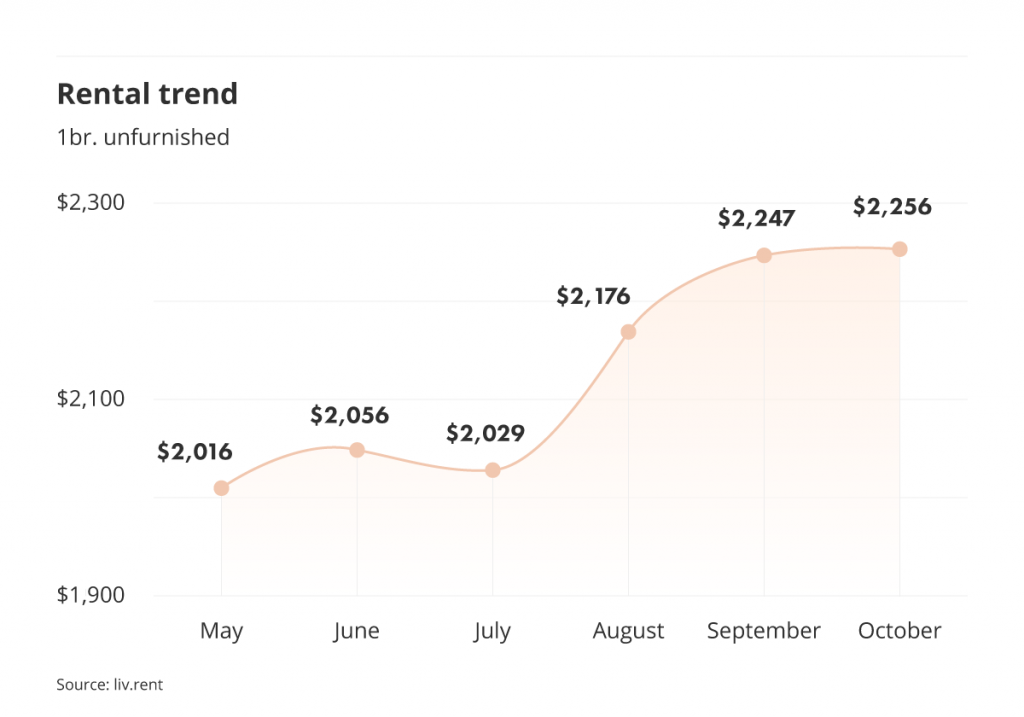
- Metro Vancouver’s average rent price for an unfurnished, one-bedroom unit has increased by just $9 this October, to $2,256.
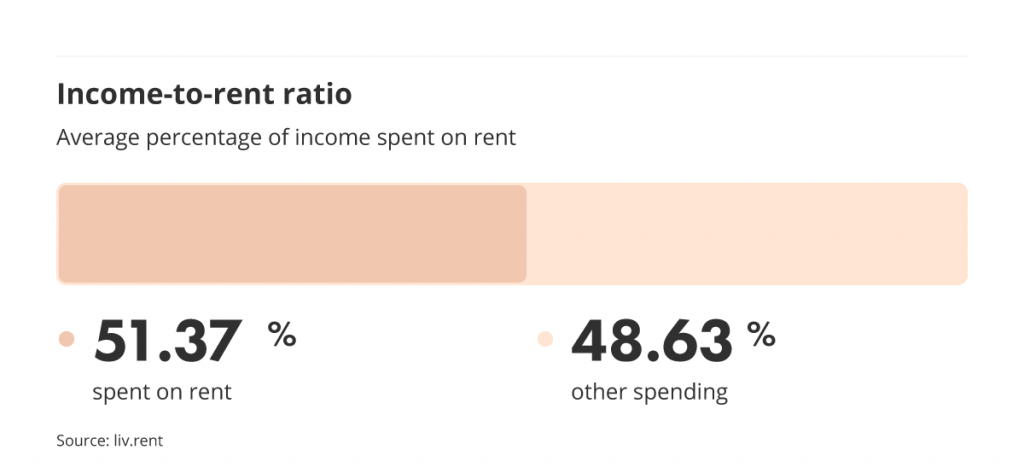
- Metro Vancouver renters are now spending 51.37% of their monthly income on rent, considerably above the recommended 30% income-to-rent ratio.
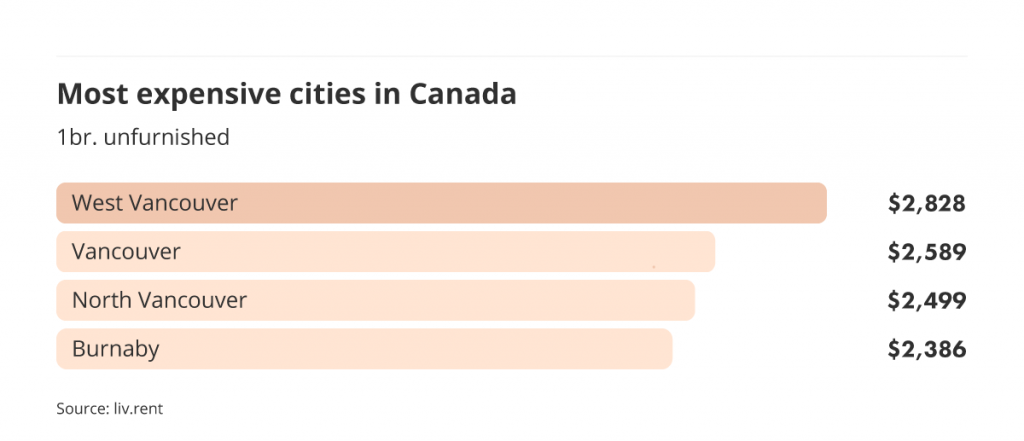
- All of Canada’s most expensive cities are now in B.C., with Burnaby also making it into the top four this October.
As we emerge from the peak renting season, average rent prices across Metro Vancouver have climbed slightly – though not nearly to the extent we’ve seen throughout the summer. This year, with interest rates continuing to climb and vacancy rates remaining low, we could see prices remain high throughout the rest of the year, although we do expect the usual dip once the colder months hit.
You can get the latest updates on the Vancouver rental market straight to your inbox when you subscribe to keep on top of the latest rent trends.
Let’s take a look now at the current rental costs and overarching trends in Vancouver for October 2022. Don’t forget, you can download the entire report as a one-page infographic PDF below.
Jump to the following Vancouver Rent Report sections:
Download The Latest Vancouver Rent Report
For the complete Vancouver rent report including new neighbourhood breakdowns, download here.
Average rent across Metro Vancouver
October sees Metro Vancouver’s average rent prices continuing to rise, albeit just barely. As the dust settles following the busy summer renting season, we’re starting to see rent prices settle in once again, just above the $2,250 mark. Between September and October 2022, Metro Vancouver’s average rent climbed just $9, from $2,247 to $2,256 this month. With students now settled in their new rentals and the hyper-competitive summer months now drawing to a close, we should see prices hold steady or begin to decline throughout the remainder of the year. We’ll take a closer look at the trends driving this change throughout this report.
Is your rental priced competitively?
Find out with a free rent estimate. Our team of rental experts will calculate your unit’s true value based on your listing details & current market trends.
Month-to-month rent change
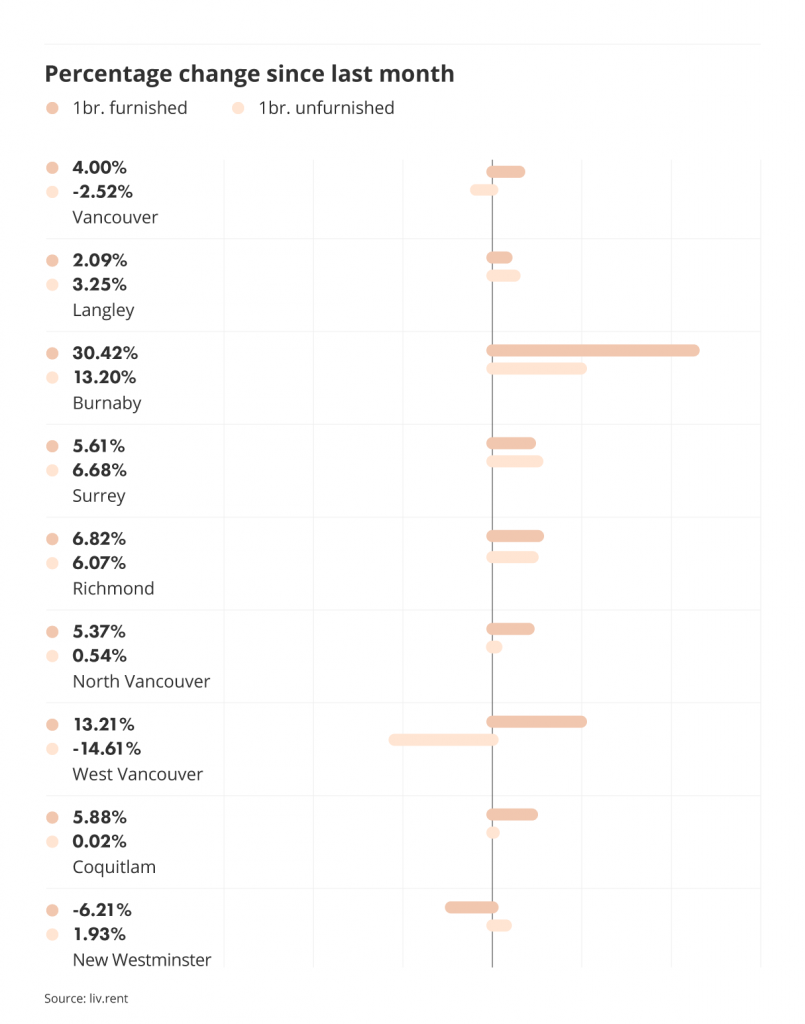
Though the aggregate, region-wide changes in average rent may have been negligible, Metro Vancouver’s individual cities & municipalities were quite volatile, with some significant changes in certain areas.
Looking at unfurnished units, West Vancouver is once again a notable outlier this month with a massive -14.61% decline. Burnaby, on the other hand, saw an almost equally large +13.20% increase month-to-month. Richmond also followed up a relatively large average rent price decrease of -11.88% last month with a +6.07% increase this October, while Surrey likewise recouped declines in price over the past few months, rising another +6.68%. In Vancouver itself, average rent prices fell by -2.52%.
For furnished units, average rent prices held a bit steadier as a whole, though there were some large-scale changes in certain areas. The most significant of these, without a doubt, was Burnaby–where the average rent for furnished units increased by almost a third, at +30.42% month-to-month. West Vancouver also saw prices climb this October, up +13.21% from the previous month. Other notable changes occurred in Richmond (+6.82%), New Westminster (-6.21%), Coquitlam (+5.88%), Surrey (+5.61%), and North Vancouver (+5.37%). In Vancouver itself, furnished rentals increased in average price by an even +4.00%.
Income-to-rent ratio
We gather data on renters’ income-to-rent ratio every month, and our most recent data shows that renters in Vancouver who use liv.rent are paying, on average, a shocking 51.37% of their income towards rent.
While traditional financial advice would be to spend no more than 30% of your income on rent, this advice is perhaps not well suited to the realities of renting in cities like Vancouver – especially as prices continue their rapid climb due to Canada’s rising interest rates.
Still, landlords and property managers should look to see that a tenant can reasonably afford rent compared to how much money they make as part of their tenant screening process.
Rent per square foot
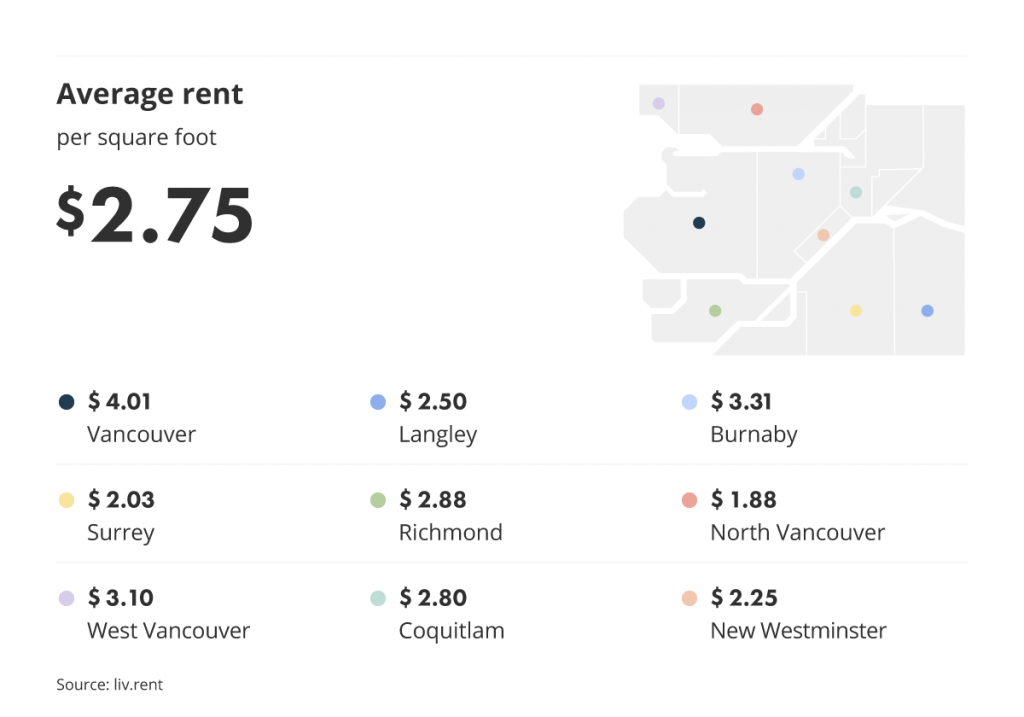
Where’s the cheapest place to rent in Metro Vancouver by how much space you get? This October, the least expensive cities for square footage are North Vancouver, Surrey, New Westminster, and Langley, while the most expensive city this month is Vancouver itself.
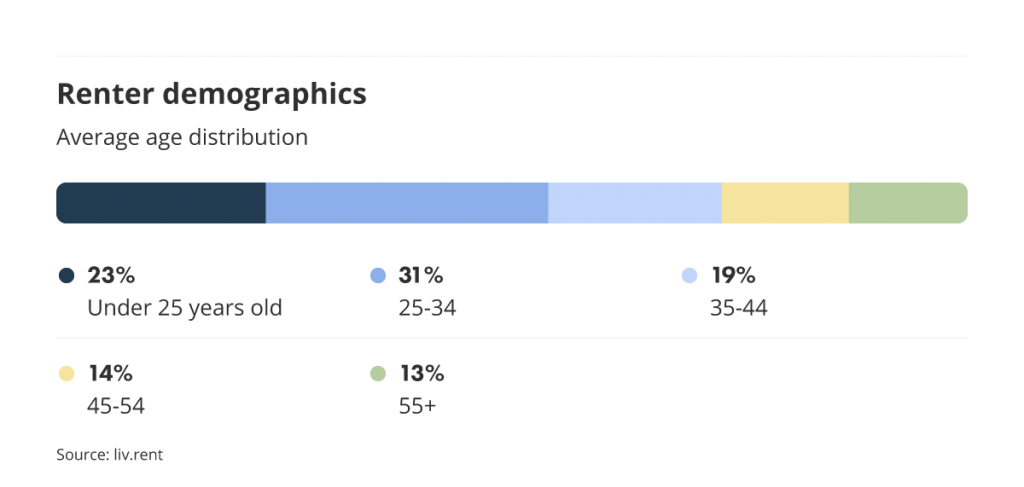
Renter demographics
On liv.rent, our renter demographics have seen a significant shift over the past year, with more and more renters from different age groups now using the platform. We’re now seeing a much more even spread, particularly with the recent influx of renters aged 35+ as well as increased representation from the younger, under-25 demographic. With that being said, the majority of renters that make up our community are between the ages of 25-34.
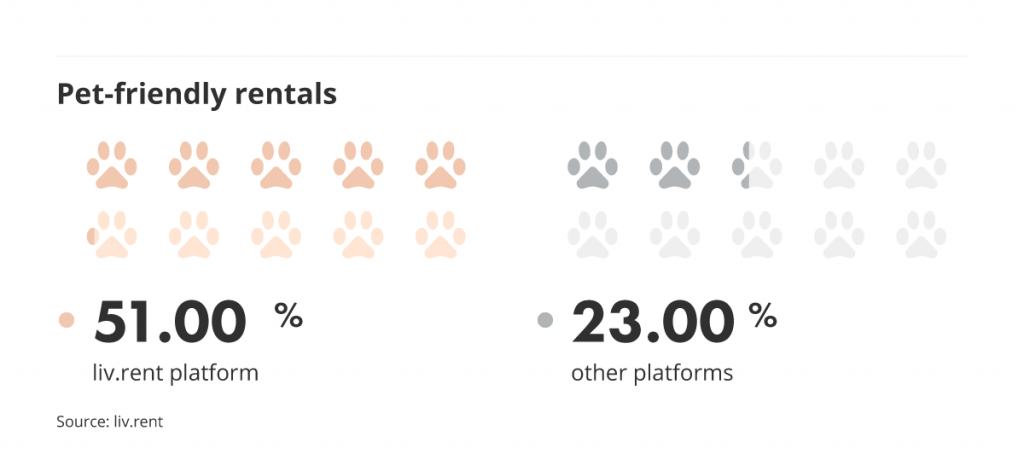
Pet-friendly rentals
We’re proud to say that liv.rent continues to be the rental platform with the most pet-friendly rentals. This August, other rental platforms had just 23.00% of units available that were pet-friendly while on liv.rent, 51.00% of listed units were pet-friendly.
>> Recommended Reading: The Top 8 Pet Friendly Neighbourhoods in Metro Vancouver
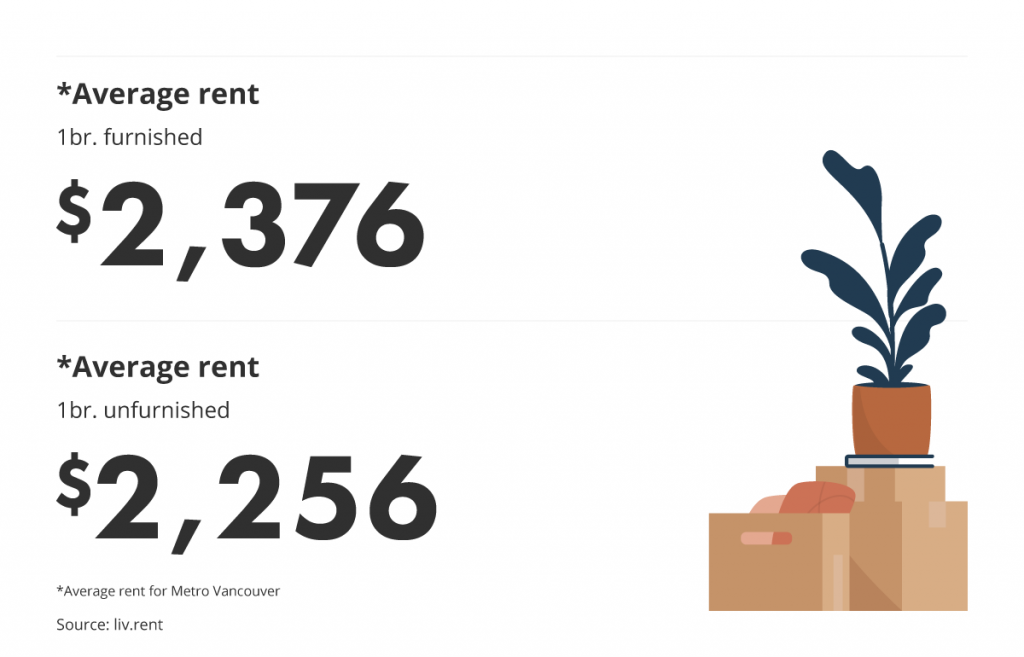
Average unfurnished vs. furnished rates
This September, furnished, one-bedroom units rented for considerably more on average than their unfurnished counterparts. As of this month, unfurnished one-bedroom units are, on average, $120 less expensive than furnished units. This indicates that landlords who choose to rent their units furnished will be able to charge a good deal for rent, likely as a result of increased demand for short-term rentals.
Is your rental priced competitively?
Find out with a free rent estimate. Our team of rental experts will calculate your unit’s true value based on your listing details & current market trends.
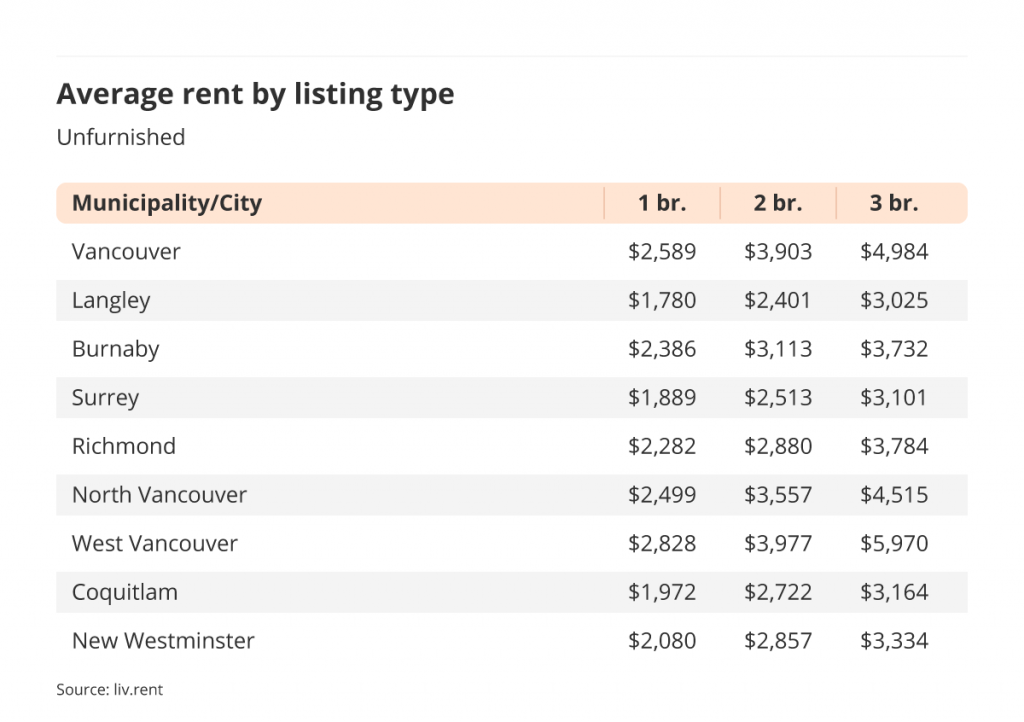
City breakdown
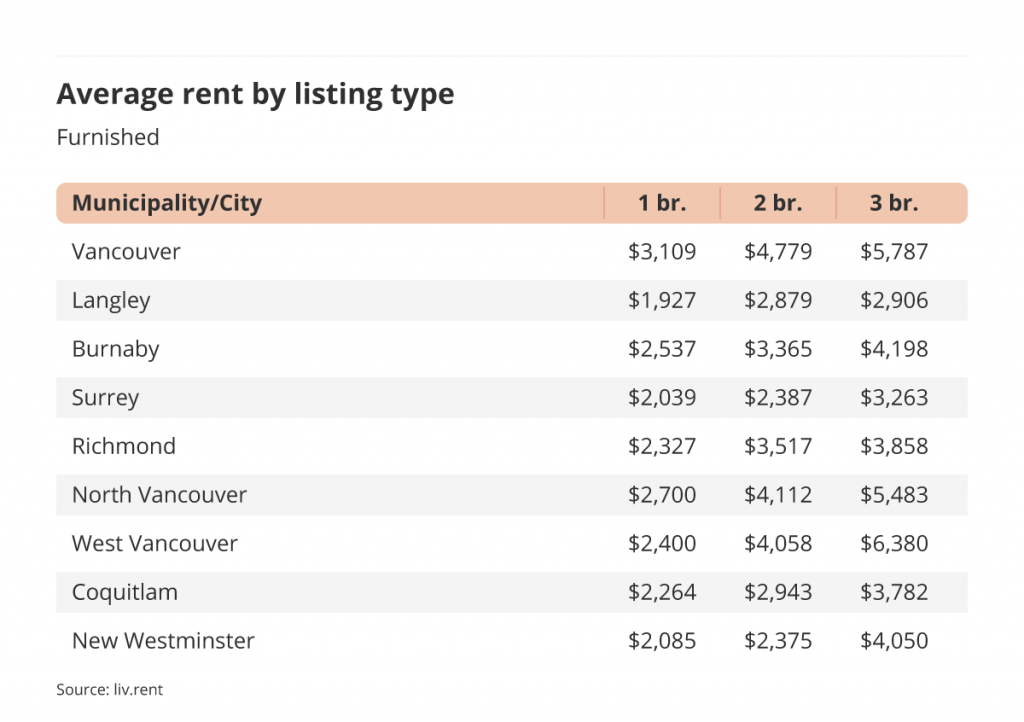
Metro Vancouver’s rental averages vary greatly across the region, so we’ve broken up our data by municipality/city to compare the cost of one-, two-, and three-bedroom rates for both furnished and unfurnished units in different areas.
- West Vancouver once again had the most expensive average rent prices for an unfurnished, one-bedroom unit this month, at $2,828.
- Langley extends its now four-month streak as the cheapest place to rent both unfurnished and furnished one-bedroom units, at $1,780 and $1,927, respectively.
- Furnished units in Vancouver were particularly expensive this month, at $3,109, $4,779, and $5,787 for one-, two-, and three-bedroom units, respectively.
Gain comprehensive insights about your listings with the new liv.rent Landlord listing Dashboard. Sign in to unlock live insights – find out the average rent for a comparable property, number of views your listing received and more!
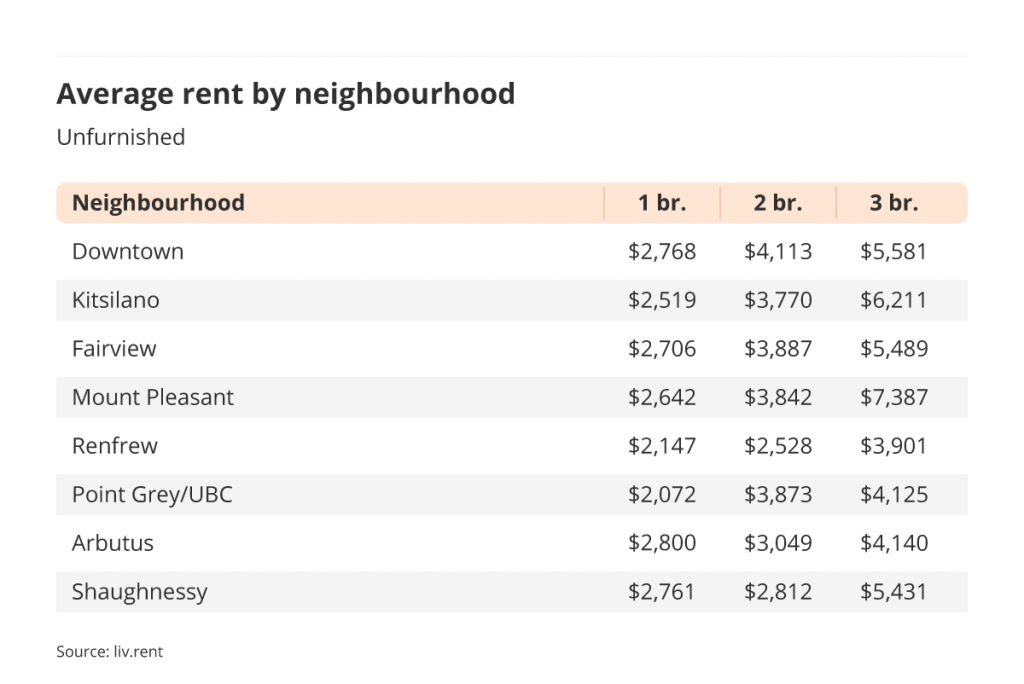
Neighbourhood breakdown
We’ve broken down Vancouver into its individual neighbourhoods for a more complete look at the city’s individual rental markets. For a further breakdown of neighbourhoods in municipalities and cities outside of Vancouver, be sure to download our complete Rent Report.
Let’s take a look now at some of the latest averages from Vancouver’s many unique neighbourhoods. This October, Arbutus has become Vancouver’s most expensive neighbourhood at an average of $2,800 for an unfurnished, one-bedroom unit, while the same type of unit rented for an average of $2,072 in Vancouver’s cheapest neighbourhood, Point Grey/UBC.
You can take a look at our neighbourhood breakdown for unfurnished units in Vancouver here. For the complete report, including furnished rentals for Vancouver neighbourhoods as well as full information for other cities in Metro Vancouver, be sure to download your copy below.
Most expensive cities in Canada
West Vancouver once again tops Vancouver as Canada’s most expensive city to rent in terms of unfurnished one-bedroom units, with the average one-bedroom, unfurnished unit in the municipality going for $2,828. North Vancouver has also made it onto the list this month in third place, with a monthly average rent of $2,499. Vancouver once again slots in at second-place, while Burnaby also makes it onto our list this October. This month is particularly notable, as it marks the first time in recent memory we’ve had an all-B.C. list of the most expensive cities in Canada.
Downloadable resources


Make Zoom calls fun and informative when you use the latest rental averages and trends as your virtual background.
Free Virtual Backgrounds: Download Here
Download The Latest Vancouver Rent Report
For the complete Vancouver rent report including new neighbourhood breakdowns, download here.
Rental resources for B.C. renters
You can read these comprehensive guides for more information on renting in B.C. and using liv.rent to streamline your rental process.
- BC Residential Tenancy Agreement Explained
- Guide to BC Tenancy Forms
- The Complete User Guide To liv.rent For Landlords & Property Managers
- The Ultimate Renter’s Guide To Using liv.rent
Data collection methodology
Our monthly rent reports use data from our own liv.rent listings, as well as data our team manually collects from other popular listing sites – looking at available basement suites, apartments, condos, townhouses, semi-detached houses, and single-detached houses for each area.
When collecting this data, we do exclude luxury properties listed at over $5,000, as well as rooms for rent and shared accommodation. Investing in manual data collection means that we only consider the current month’s listing, since we can filter out duplicate listings and older ads that haven’t been removed.
Another key difference between our data collection methods and some government agencies like the CMHC is that we only include current asking rent prices. Many official reports will include data for entire buildings in their reports, which tends to skew numbers lower since many units are already occupied, and may be rent-controlled or rented for significantly lower than the current rates.
As we are a Canadian rental platform founded and based in Vancouver, we want to ensure that we’re providing a completely accurate depiction of the rental market in the cities we look at.
Rethink The Way You Rent
Not on liv.rent yet? Experience the ease of digital applications & contracts, verified tenants & landlords, virtual tours and more – all on one platform. Sign up for free or download the app.
Subscribe to receive these monthly updates on the Vancouver rental market. Discover last month’s Rent Reports below:
September 2022 Metro Vancouver Rent Report
September 2022 Toronto Rent Report
September 2022 Montreal Rent Report


0 Comments